27. 27 capturing should be reviewed taking into consideration of the needs of MDAs and by also intensifying engagement s with the MDAs .
11. 11 and service provider is very limited, which reduces the instances where corrupt practices can occur. The low levels of reporting reduces the data se t, the representational value of the data and increases the volatility. Figure 17 : Electricity reports and Districts in Q3 of 2017 Western Area Urban accounted for 56% of all reports on the Electricity Sector , which is higher than the averages frequency of 44% of all reports concerning Electricity coming from Western Area Urban (table 2). Figure 18 : Electricity and Services in Q3 of 2017
6. 6 relative decline. Please note that numerically reporting in both Western Area Urban and in Bombali District increased, but not as much as in Bo District. Figure 9 : Distribution between Districts in Q 3 2017 Figure 10 : Distribution between Districts in Q4 2017 The inclusion of Kono District in October as an implementing district in the PNB Campaign had an immediate impact on the data (figure 11). Figure 11 : Distribution of reports between Districts since inception Furthermore, it is noticeable, that the increased reporting from Bo District coincided with the rollout of the new outreach strategy. Prior to the new outreach strategy, the CSO’s operating in the various district had significant different approaches to the outreach. In Bo District, CARL had strong MDA engagements aiming towards cooperating with the MDAs to reduce the level of bribery, whereas Kenema and Bombali to a larger extend focused on sensitizing the public and encouraging them to report to the PNB Campaign. In the new strategy the best aspects of both approaches are applied.
26. 26 Figure 38 : Age distribution per sector in Q3 2017 The youth (15 - 29 years) accounted for the majority of reporting to the Education sector. In the Health sector , it was primarily young and adult women, whereas for the police , it is young and adult men. The above 50 years old had the highest reporting ratio on Electricity, Water and Others. The above demographics of reporting reflects the user demographics in the va rious sectors; Young people attends educational institutions , pregnant women and mot her s t ake children for Health Care, the commercial drivers are primarily men , the people able to have water and electricity installed are of a certain age, before they afford accessing these services . That is the reason why the 15 - 29 years have the majority of reporting for Education, Women for Health Care, Men for Police and few young people reports on Electricity and Water. 6. Actions points for the PNB Programme Hig h dependence on CSO animators to encourage the public to report is a cause for concern as this has the potential to increase the volatility of reporting thereby making trend analysis less feasible and reduces the sustainability of the programme. As a res ult, i n order to encourage the public to make their reports directly into the PNB Pla tform, the PNB Programme should focus more on the outreach activities that promote self - reporting. This can be accomplished by focusing the communication on the positive a chievement of the PNB Programme . That is, the actions taken by the MDAs to reduce bribery and improve service delivery, as well as further sensitizing the public on how to self - report without a CSO animator being present. The above requires that the PNB produces actionable data and provides support to the MDAs in identifying areas of concern and possible actions to address these. Hence, the data
21. 21 “New Connection” was the most frequently reported service (43%), as it also was the case for the Electricity Sector. The second highest was “Illegal Connection” with 33%, which may suggest challenges for the Water com panies in limiting/controlling these. The dismantling of Illegal Connection is also a human intervention and not an automatic, which makes it more vulnerable for bribery. Figure 30 : Distribution of Water Sector reports between Services in 12 months On an average since inception, Illegal Connection has constituted 17% of the Water Sector reports and it is therefore significantly higher with 33% in the 3 rd quarter of 2017. Otherwise, figure 27 show the high degree of volatility of the data relating to th e Water Sector, which is a consequence of the low level of reporting.
9. 9 Figure 14 : Disaggregation of Reports in Services for Education (Q3 2017) In the 3 rd quarter “Grades and Exams” where the most frequently reported services in Education. From the inception of the PNB Campaign in the end of September 2019 , Education has been the most volatile sector in terms of seasonal changes on the m ost and least reported services, as show in figure 15 below. Figure 15 : Distribution of Services reported under Education
25. 25 There is almost an equal gender distribution in the overall PNB reporting. While the overall gender distribution is equal there are variances between the various sectors. Figure 35 : Gender distribution per sector in Q3 2017 Most sectors had a relatively equal gender distribution apart from Health Care, which is primarily women reporting, and Police, where men accounted for the majori ty of reporting. Figure 36 : Age d istribution in Q3 2017 Figure 37 : Average age d istribution 12 months The age distribution of the 3 rd quarter of 2017 was similar to the yearly average with a minor increase in Above 50 Years reporting ratio and a minor decline in 30 - 49 years reporting.
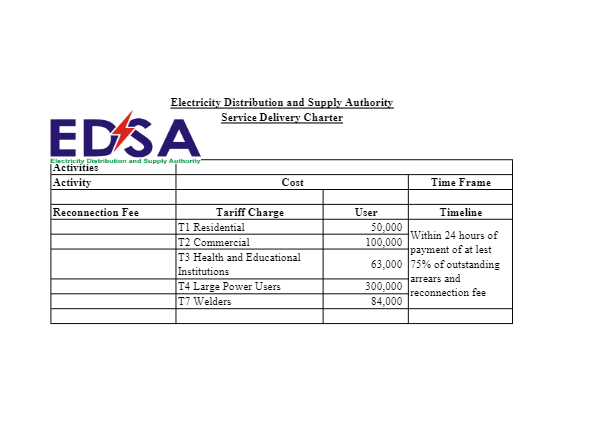
12. 12 During the 3 rd quarter “New Connections” was most frequently reported with 39% of all reports, followed by “Meter Replacement” (25%) and “Reconnection” (22%). Figure 18 : Distribution of reporting on Services for Electricity in 12 month In the last year of the programm e there has been minor fluctuations as seen in Figure 18 . H owever, on average , distribution is relatively close to the Q3 data with 40% for “New Connections”, 22 for “Meter Replacement” and 25% for “Reconnection. The reason for the fluctuation is most like ly the volatility caused by a relatively small dataset. It is noticeable, that while “Reduced Bill” initially was scoped as an important issue for bribery in the Electricity sector, there has only been few reports on it. This can be attributed to the imp lementation of pre - paid meters by EDSA, which reduces the opportunities for corrupt practices in the providing electricity. The services with the highest level of reporting are, on the contrary, those with a high degree of human interaction (New Connection , Meter Replacement, and Reconnection ). In February to April, Meter Replacement had an increase in reporting ratio. In this period EDSA was challenged by supplying new meters, which generated delays for the costumers. The discontent and/or attempt to circumvent the delayed process could be the c ause of the upsurge in Meter Replacement reporting during that period.
5. 5 Figure 6 : Distribution between Sectors in Q3 2017 Figure 7 : Distribution between Sectors in Q4 2017 Over the full period, few variances can be detected but overall the report distribution remains relatively stable month after month . Particularly Health Care maintains a relatively stable average of 28% while Education and some of the lesser reported services fluctuate more. The fluctuation in the relative reporting to Education can be due to seasonal changes (the school calendar), whereas the need for Health Care services are constant. Figure 8 : Distribution of reports between Sectors since inception The distribution of re ports in the targeted Districts change d significantly from the 3 rd quarter to the 4 th quarter of 2017 – particularly due to the inclusion of Kono District - as shown in figure 9 and 10. In addition, Bo District experienced a significant increase in reporting relatively to the other districts, while the reporting in Western Area Urban and Bombali had a
18. 18 Since the start of the PNB programme, the Health Care Sector has received 39% of all reports in respect of “ I did not pay a Bribe” or “I met an Honest Official” , because it is a sector where users are more inclined to show appreciation. Ho wever, the concentration of reports at few services and locations is an issue which the programme should look into . This could likely be as a result of a high degree of appreciation by the public, sensitization at the specific location carried out by the s taff, false reporting or an error in the data capturing multiplying the number of reports. Figure 27 : Distribution of Health Care Sector reports between Services in 12 months The Health Care Sector has experienced a relatively stable distribution of re ports, with at an average 32% for “Under 5 - child health” and 32% for “Pregnancy and Child Birth”, which is relatively close to the 3 rd quarter distribution. The high level of reports concerning these services can be attributed to the widespread public awareness about these service under the free health care . This has made easier for the public to recognize if illegitimate charges are added (I Paid a Bribe) The high levels of report in this sector can also be attribut ed to the level of appreciation when service is delivered (I met an Honest Official).
16. 16 programme had a high freque ncy for “Traffic”, it could suggest that the interventions of SLP targeting traffic related bribery in Kenema has had a positive effect. Health Care Sector 27% of the reports made by the public in the 3 rd quarter of 2017 related to the Health Care sector, which is exactly the same ratio as for the first 12 months of the PNB Programme. Figure 25 : Disaggregation of Health Care Sector reports in Districts in Q3 2017 The most noticeable on the district disaggregation of Health Care reports is the high number of “I did Not Pay a Bribe” reports from Western Area Urban, combined with the relatively low number of “I Paid a Bribe” reports from the same location and from Bo District.
20. 20 The overall distribution can represent the way in which service is delivered in the capital vis - à - vis the Districts, where the former has many large hospitals and the service in the latter is delivered at a multitude of smaller Clinics and PHUs. The highe r frequency of “I Paid a Reports” in the districts, could suggest that the challenges with delivering Health Care services without invoking additional charges are higher in the district than in the capital. The CSO animators reports that there are challeng es with both supplies and payment of staff in the districts, which could be the cause of such issues. Water Sector The Water Sector has an even lower level of reporting than the Electricity Sector with an average of only 2% of the total number of reports (figure 12) and 3% in the 3 rd quarter of 2017. Being a utility sector with a limited penetration, just like the Electricity Sector, similar factors of limited distribution and infrequent interaction with service providers apply. The extremely low l evel of reporting make the date even more vulnerable to representational reporting and subject to a high level of volatility. Figure 28 : Disaggregation of Water Sector reports in Districts in Q3 2017 93% of all reports relating to the Water Sector der ived from Western Area Urban in the 3 rd quarter of 2017. That is a significantly higher than the average of 71%. On the same token, the ratio of reporting from the other districts declined correspondingly. Figure 29 : Disaggregation of Water Sector reports between Services in Q3 2017
14. 14 The district distribution of reports differed significantly from the yearly average in table 2. Western Area Urban had, mainly due to a large number of “I did not pay a Bribe” reports, higher frequen cy than the yearly average (47 % Q3, 35% year), just as Western Area Rural (20% Q3, 10% year) and Bombali ( 19 % Q3, 16% year). On the opposite spectrum, Kenema reduced its frequency from 31% yearly average to 11% in Q3. Bo only received 3% of all Police reports in the 3 rd Quarter. This variance from the genera l trend can either be seen as a result of the SLPs actions in Kenema in response to the PNB Data, or as caused by the decline in reporting from Kenema in the 3 rd quarter of 2017 (figure 9 and 10). Since Kenema during the first 12 months of the programme ha d a relatively high average on Police reporting (table 2), the decline is most significant in this sector. Figure 22 : Police reports by Sectors in Q3 2017 “ Traffic” remain ed the most commonly reported service followed by “Bail” .
22. 22 Figure 31 : Disaggregation I Paid a Bribe reports in Districts and Services in Q3 2017 15 of the 36 I Paid a Bribe reports on “Illegal Connection” in Western Area Urban came from Juba and 32 of 45 reports on “New Connection” from Portee. However, the GUMA Valley Water Company has reported that they have not carried out any New Connections in that area. Therefore , the repor ts could relate to other private service providers, as suggested by the CSO animator in the area . This implies that an indication of the service provider could be a useful addition to the PNB reporting platform. 4. Distribution of Method of Payment and Value of Payment per Sector Paying a bribe cannot be reduce d to the transfer of cash. Bribes can also be in Services and Favour, Products or Sexual Favours. K nowledge on the nature of bribes for specific sectors/services can be valuable in designing targeted sensitization and responses to these sectors/services. Figure 32: Distribution of Method of Payment in Q3 2017 Figure 33 : Average Distribution of Method of Payment
3. 3 reports entered through the app as mainly facilitated by CSO animators. Furthermore, the call centre or toll free 515 line was c onsidered as the most sustainable reporting mechanism since it was the most accessible for the majority of the population. Figure 2 below, however, shows that while reporting through the call centre increased from the 3 rd to the 4 th quarter, the vast majo rity of the overall increase derives form an increase in PNB Mobile App reporting. Figure 2 : Distribution of reports by Source since inception It should be noted that the perception that App reports mainly were reports facilitated by animators, has been challenged by the CSO’s as they argue that citizens they engage with to large extent has smartphone and is sharing/downloading the app for personal use. It is therefore questionable is the objective of increasing the volume of se l f - reporting has been achi eved. As argued in the previous report, animator activities declined significantly during the 2017 Christmas holiday season. A more sustained reporting level during the 2018 Christmas could be an indication that self - reporting has increased and the sustain ability of the campaign improved. 2. Distribution of report s The increase in reporting to the PNB platform in the 4 th quarter occurred for all indicators, but it distribution of reports shifted slightly toward “I paid a bribe” on the expense of “I did not pay a bribe”. “I met an honest official” maintained the same share of the total number of reports as in the previous quarters.
15. 15 Figure 23 : Distribution of reporting on Services for Police in 12 month Since inception this pattern has been consistent with “Traffic” accounting for 69% and “Bail” for 17% of all Police Reports. Figure 24 : I Paid a Bribe reports for Police in Q3 of 2017 W hile “Bail” only constitutes at an average 17% of all re ports relating to the Police, 35 % of all reports in Western Area Urban in the 3 rd quarter of 2017 related to “Bail”. This significant variation from the average mainly derived from two location in the East - End of Freetown: Kissy (74) and Up - Gun (69). Furthermore, it is noticeable that "Traffic” only constitutes 50% of the Kenema reports, which is below the average of 69%. Particularly considering that Kenema earlier in the
4. 4 Figure 3 : Distribution of reports in 3 rd quarter 2017 Figure 4 : Distribution of reports in 4 th quarter 2017 In the longer term, as can be seen in Figure 5, it appears that “I did not pay a bribe” has the highest volatility between 4 - 28% (13% in average), whereas “I met an honest official” continuously is close to the average of 9% of the reports. Figure 5 : Dis tribution of reports by What Happened since inception With regards to the distribution of reports between Sectors, a similar picture emerges when comparing the 3 rd and 4 th quarter of 2017, with an almost identical distribution despite a large variance in the number of reports received – which also was argued in the previous report.
2. 2 1. Overall number of reports received In October 2017 the PNB Campaign included Kono District and started rolling out a new outreach and communication strategy. As the data of this report shows, t he new approach led to a radical increase in reporting for all Sectors and Services. Thus, the increase should not be interpreted as an increase in corrupt pr actices within the MDA s , but as a result of a better outreach by the PNB. The increase in volume, nonetheless, make the data set more accurate and thus easier to respond to for the MDAs. During the fourth quarter of 2017 , the PNB Campaign received 19,651 reports . This represents a substantial increase of 241 % in comparison to the 5,768 reports received in the previous quarter . Furthermore, as illustrated in Figure 1 below, the reporting in the 4 th quarter reached significantly higher levels than previous ly in the program. Figure 1 : Distribution of reports since inception The steep increase from October to December 2017 coincides with the inclusion of Kono District in the campaign and the implementation of the new outreach strategy. New Outreach Strat egy implemented from October to November The PNB Quarterly Narrative Report for the 3 rd quarter of 2017 showed that the reporting levels to the PNB Campaign to a large degree depended on the activity level of the CSO Animators. The PNB Campaign identified reliance on CSO Animators facilitating reports to be an issue for the sustainability of the programme, to increase the volatility and have a negative impact on the ability to conduct trend analysis on the basis of the data. Therefore, a new outreach strate gy aimed at increasing the number of self - reporting of the citizens were devised in August/September and rolled out from the 4 th of October to the 9 th of November . In order to gauge the volume of “self - reporting” in the anonymous reporting platform, the PNB considered the majority of reports through the call centre to be self - reporting, whereas
13. 13 Figure 20 : I Paid a Bribe reports for Electricity in Q3 of 2017 Report s on the Electricity sector are generally focused on few locations. In the 3 rd quarter of 2017, all 18 reports o n “Reduced Bill” came from Makari Gbanti in Bombali . 32 of 50 reports on “New Connection” in Western Area Urban came from Portee and 13 of 30 reports on Meter Replacement in Western Area Urban came from Juba. These “hotspots” can either be caused by the te ams working in the area, the activity of the CSO animators or misrepresentation caused by a too small dataset. Sierra Leone Police The Police received a total of 2345 reports in the 3 rd quarter of 2017 , which is 40% of all reports captured by PNB in the p eriod and slightly below the yearly average of 42% (figure 7 and 12). Of the reports 1719 related to “I Paid a Bribe, 504 to “I Did Not Pay a Bribe” and 122 on “I Met an Honest Official”. Figure 21 : Distribution of Police reports in Districts in Q3 2017
10. 10 Figure 15 shows that in April to July there w as a high frequency of reporting on “Grades and Exams”. In July and August, “Report Card” w ere frequently reported, while in August and more so in September, “Admissions” w ere the most reported service. This reporting pattern reflect s , with a slight delay , the school calendar year. Hence, the PNB reports about services provided by the Education sector reflect the school calendar. Since the provision of services within the Education sector is seasonal, it is not suitable to benchmark one month to the next. H owever, information of the seasonal occurrence of bribery for certain services can be used to do time specific sensitization and interventions. Figure 16 : I Paid a Bribe for Services each District (Q3) “I Paid a Bribe” reporting on “Grades and Exams”, w hich were the most reported, had high frequency in all Districts apart from Western Area Urban. Reporting on “Report Cards” followed a similar pattern as “Grades and Exams”, since they are related services as the Exams leads to the issuing of Report Cards. Notably, reporting on “Others” almost solely derived from Bombali and Kenema Districts. Based on the feedback provided by the Call Centre operators, who receive reports directly from the public, we know that a large proportion of reports on “Other s ” in t he Education Sector relates to the School Feeding Programme. The high level of reporting from Bombali Di strict, and particularly Bombali Shebora, is a concern, since it is significantly higher than the cross sector average. Furthermore, the reporting on “Others” could indicate challenges for the School Feeding Programme in Bombali and Kenema District. Electricity Sector Electricity only receives on an average 4% of the reports, which is exactly the same ratio as in the 3 rd quarter (figure 7 and 12). The relative low level of reporting is likely due to two factors: distribution of service and level of interaction with service providers. Electricity services are not accessible in most parts of the country, which reduces the n umber of potential users significantly. Secondly, after initial installation the interaction between user
17. 17 Figure 26 : Disaggregation of Health Care Sector reports in Services in Q3 2017 “Pregnancy and Child Birth” accounted for 33% and “Under 5 Child Health” for 27% of the reports to the Health Care Sector in Q3. A significant proportion of these were “I did not pay a Bribe” particul arly from Western Area Urban. Figure 27: “Pregnancy and Child Birth” and “Under 5 Child Health” in Western Area Urban Q3 The “I did not Pay a Bribe” reports constituted 92% of all reports relating to “Pregnancy and Child Birth” and “Under 5 Child Health” in Western Area Urban. In Western Area Urban 73% of these reports came from Ola During Ch ildren ’ s Hospital and 26% from P C M Hospital . 4028 50 66 38 25 0 500 1000 1500 2000 2500 3000 3500 4000 4500 Cash Other Products, Animals or Food Service and Favours Sexual Favours Total Total
1. 1 Quarterly Data Analysis for PNB Reporting Platform 26 th October - 26 th December 2017 This re port presents data for the 5 sectors of the PNB Campaign (Education, Electricity, Health Care, Sierra Leone Police , and Water) from the Pay No Bribe Reporting Platform for the period, 26 th June – 26 th September 2017 . The data represent reports received from the public under the three reporting mechanisms: The 515 hotline; Mobile Apps ; and Website. The data present repo rting from the 6 implementing districts of Bo, Bombal i , Kenema, Kono, Western Area Urban and Western Area Rural. The PNB Campaign was launched in Kono District on the 4 th of October 2017 and has therefore been included as one of the implementing districts. Kono District was added to the PNB Campaign. D ata is presented under the following headings: 1. Overall number of reports received ................................ ................................ ................... 2 2. Distribution of report – a new way to perceive trends ................................ ....................... 3 3. Distribution of reports received under each sector ................................ ............................ 8 Education ................................ ................................ ................................ ........................... 8 Electricity Sector ................................ ................................ ................................ .............. 10 Sierra Leo ne Police ................................ ................................ ................................ .......... 13 Health Care Sector ................................ ................................ ................................ ........... 16 Water Sector ................................ ................................ ................................ ..................... 20 4. Distribution of Method of Payment and Value of Payment per Sector ........................... 22 5. Demographics of reporting ................................ ................................ .............................. 24 6. Actions points for the PNB Programme ................................ ................................ .......... 26
8. 8 Bombali District 35% 24% 25% 16% 3% 24% 23% Kenema District 34% 17% 35% 31% 17% 47% 33% Western Area Rural 8% 4% 9% 10% 5% 1% 8% Western Area Urban 13% 44% 22% 35% 71% 24% 28% T he following sections explore the data of the 3 rd quarter of 2017 at both district and service level s . 3. Distribution of reports received under each sector In this section the distribution of “I Paid a Bribe”, “I did not pay a Bribe” and “I Met an Honest Official” will be presented for each of the 5 sectors of the Pay No Bribe Campaign. Education Education received a total of 1230 reports in the 3 rd quarte r of 2017, out of which 1045 were “I Paid a Bribe”, 76 “I did Not Pay a Bribe” and 109 “I met an Honest Official”. While the volume of report on Education decreased significantly from the 2 nd quarter, Education still received 21% of all reports (figure 7), which is very close to the baseline of 20% (figure 12). Figure 13 : Education reports and Districts in Q3 of 2017 Bombali District received 42% of the reports on Education in the 3 rd quarter, which is higher than the cross sector average of 29% for reporting on Bombali District (figure 1). Similarly , Kenema District had a higher ratio of Education reports (16%) compared to the cross sector average (15%). On the other end of the scale, Western Area Urban only received 11% of the Education reports compared to 36% of all reports. Hence, reporting on the Education Sector was relatively higher in Bombali and Kenema compared to the other districts, while it was significantly lower for Wester n Area Urban.
24. 24 251.000 - 500.000 SLL 13 8 6 11 8 48 94 Above 500.000 SLL 1 1 3 5 10 Other/Beyond Value 1 1 9 11 Sexual Favours 22 1 1 1 25 Total number of reports 1045 208 900 1719 110 225 4207 Total Mean Value in SLL of reported bribes 31.919. 500 22.233.0 00 27.781. 500 61.106. 500 12.560.5 00 34.341.5 00 189.942.50 0 Average Median Value per Bribery in SLL 31.232 106.889 30.937 35.568 114.186 159.728 45.539 The Police accounted for the highest tota l value of reported bribes paid in the 3 rd quarter of 2017 with a total of 61.106.500 LE . The Police also had the highest number of received reports. “Other Sectors” followed with a total value of 34.341.500 LE , despite having received relatively few reports . The average value for the reported bribes under “Other Sectors” was much higher than the remaining sectors, so even with few report the total value exceeded that of the r emaining sectors. In general, t he average value of reported bribes is lowest in the most frequently reported sectors (Police, Education and Health Care), while being highest in the less frequently reported sectors (Electricity, Water, Other). As describe d previously, Water and Electricity are sectors where there is less direct interaction between the public and the service provider. However, when the interaction is required, for instance to carry out installations, the value of a potential bribe is high. The opposite applies to the Police, Education and Health Care, where the service delivery always involved human interaction. This makes it more vulnerable to bribery , but the value of a potential bribe is relatively low. 5. Demographics of reporting Figu re 34 : Distribution of Gender in Q3 2017 Figure 35 : Average Distribution of Gender 12 months
7. 7 The data shows that in the months o f the 4 th quarter, the reporting was more equally distributed between the districts and that the data did not fluctuate as much as previously. This can be seen as a result of a more harmonized outreach approach applied by the CSOs. It is therefore expecte d that the level of outreach carried out by the CSO will be more consistent and less volatile in the future. Figure 12 : Baseline d istribution of reports between sectors in first 12 months Note that local variances are not caused by the level of outreac h, but also of differences in sectors and services delivered in particular areas Table 1 : District baseline d istribution of reports between sectors in first 12 months Education Electricity Health Care Police Water Other Bo District 21% 5% 29% 41% 1% 3% Bombali District 31% 5% 30% 29% 0% 5% Kenema District 20% 2% 29% 40% 1% 7% Western Area Rural 20% 2% 28% 49% 1% 0% Western Area Urban 10% 7% 21% 53% 4% 4% Grand Total 20% 4% 27% 42% 2% 5% Table 1 shows that there are recognizable differences in the distribution of reports in the Districts. For Education, Bombali District received 31% while Western Area Urban received only 10%. For Electricity and Water, the highest frequency was in Western Area Urban (7% and 4%), w hich is surprising since these are services mainly provided in urban areas. Health Care was relatively equally distributed, whereas for the P olice s ector Bombali stands out with only 29% of the reporting. Table 2 : Sector baseline d istribution of repo rts between districts in first 12 months Education Electricity Health Care Police Water Other Total Bo District 9% 11% 9% 9% 4% 5% 9%
23. 23 In the 3 rd quarter , Cash had a high prevalence as the most reported method of payment ; 96 % of all “I Paid a Bribe” repo rts . Products , Food and Animals constituted 1,6 % and the rest less than a percentage (figure 32), which is very close to the average distribution of the first 12 months of the programme (figure 33). The extraordinar il y high prevalence of cash as the reported method of payment, can have 2 main causes: 1. The cash is the simplest, easiest and most anonymous way to transfer value, and therefore a preferred method of payments of bribes, 2. That there is an underreporting of bribes paid using other methods of pa yment, since the payee may not recognize services or a favour as bribes, but con siders it similar to a legitimate social gesture. If the former is the case, capturing method of payment is less relevant, since proportion of bribes paid using other methods of payment are not statically significant. I t is a latter , the public should be further sensitized on what can constitute a bribe, so the public knows that providing unwarranted services and favours also can constitute bribery. Table 4 : Method of Payment in Piloted Sectors Cash Products, Animals or Food Service and Favours Sexual Favours Other Grand Total Education 963 32 12 22 16 1045 Electricity 205 3 208 Health Care 837 32 22 1 8 900 Police 1709 1 3 1 5 1719 Water 103 7 110 Other 211 1 1 1 11 225 Grand Total 4028 66 38 25 50 4207 Education and Health Care had the highest frequency of non - cash reported bribes, with Bombali District accounting for 68% of all non - cash reports in Q3 and Western Area Urban only 4%. Education had the vast majority of reports on Sexual Favours (88%) and 18 of the 22 reports came from a single chiefdom in Bombali District. Table 5: Value of Payment in Q3 Education Electricity Health Care Police Water Other Total 0 - 5000 SLL 282 2 134 237 4 2 661 6000 - 10.000 SLL 286 10 236 318 9 3 862 11.000 - 50.000 SLL 295 50 414 818 21 57 1655 51.000 - 100.000 SLL 109 66 86 307 31 55 654 101.000 - 250.000 SLL 36 72 21 24 37 45 235
19. 19 Table 3 : I Paid a Bribe reports for the Health Care Sector in Q3 of 2017 Certificate (health, birth, death) Drugs and Treatment Emergency Care Medical Tests Pregnancy and Child Birth Registration and Consultation Under 5 Child Health Vaccinations Other Grand Total Bo District 3 9 8 13 2 16 1 52 Bo Government Hospital 3 5 8 Government Clinic or PHU 9 3 13 2 16 43 Private or NGO Hospital 1 1 Bombali District 15 35 3 16 102 33 81 2 14 301 Government Clinic or PHU 15 34 1 12 73 28 67 1 13 244 Makeni Government Hospital 1 2 4 29 5 9 1 1 52 Private or NGO Hospital 5 5 Kenema District 8 3 7 8 84 21 82 3 10 226 Government Clinic or PHU 7 3 5 74 1 73 2 10 175 Kenema Government Hospital 1 2 8 10 20 9 1 51 Western Area Rural 39 10 12 41 40 16 56 14 228 Government Clinic or PHU 39 10 12 40 40 15 56 14 226 Private or NGO Hospital 1 1 2 Western Area Urban 5 36 9 30 11 2 93 Connaught Hospital 1 1 Kingtom Police Hospital (MI Room) 1 1 Lumley Government Hospital 3 3 3 9 Macauley Satellite Hospital 1 1 Ola During Children's Hospital 1 16 8 8 1 34 PCM Hospital 7 3 2 12 Prison Hospital 1 1 Private or NGO Hospital 7 1 3 11 Rokupa Government Hospital 1 2 1 4 Wilberforce Military Hospital 1 1 Government Clinic or PHU 1 2 3 10 1 1 18 Grand Total 62 56 31 109 248 102 246 22 24 900 While the “I did not pay a bribe” report s concentrated on few locations in Western Area Urban, the “I Paid a Bribe” report s focused on the “Government Clinics and PHUs” in the Districts. The relatively few reports on “I Paid a Bribe” from Western Area Urban mainly came from Ol a During Children’s Hospital.