Baseline Survey - Full report
Share on Social Networks
Share Link
Use permanent link to share in social mediaShare with a friend
Please login to send this document by email!
Embed in your website
1. Pay No Bribe , Sierra Leone: Household Baseline Survey and Analysis of Afrobarometer Data . September 2016
2. PAY NO BRIBE / BASELINE SURVEY Contents Abbreviations and Acronyms Executive Summary 1 Introduction 4 Methodologies 6 Background To Survey Data 7 Detailed Baseline Findings By Logframe Indicator: Impact Level 8 Detailed Baseline Findings by Logframe Indicator: Outcome Level 20 Detailed Baseline Findings by Logframe Indicator: Output Level Detailed Baseline Findings: Focus Group and Kii Discussions 22 27 Conclusion 29 Annex 1 30 Annex 2 35 Annex 3 39 i
3. PAY NO BRIBE / BASELINE SURVEY Abbreviations and Acron yms ACC Anti - Corruption Commission CSOs Civil Society Organization CSW Commercial Sex W orker DFID Department for International Development EAs E numeration A reas FGDs Focus Group Discussions FHC Free Health Care GoSL Government of Sierra Leone MDAs Ministries, Departments and Agencies PHU Peripheral Health Unit PNB Pay No Bribe PPPS Probability Proportionate to Population Size U5 Under - Five
8. PAY NO BRIBE/ BASELI NE SURVEY 13.1 There were 720 respondents for the household survey, which included 479 in pilot districts and 241 in control districts. 50.4% of the respondents were male and 49.6% were female. Full details of sample selection and calculations are in Annex 1. Each sample unit had an e qual chance of being selected and yielded a representative sample of the population. 5
9. PAY NO BRIBE/ BASELI NE SURVEY 3 Methodologies 14.1 Data Collection and Quality Assurance: Data collection lasted for a period of ten days. The data collectors worked as a team to collect the baseline data, with two enumerators and one supervisor per district. The enumerators administered the household and key informant interview questionnaires, while the supervisors led the focus group discussions, in conjunction with the field coordinators and/or lead consultants. The supervisors also closely worked with the enumerators to ensure that all questionnaires were checked for completeness, and possible errors corrected with respondents in the field. Early training on FGDs indicated that they were more complex than initially thought, and the supervisors vetted all completed questionnaires to ensure completeness and quality of data collected. In addition, the lead Consultants provided overall oversight coordination to the fieldwork. 15.1 Da ta Processing, Entry, Analysis and Reporting: Four data entry clerks were hired and trained to enter data. Data was entered in Statistical Package for the Social Sciences (SPSS) data entry editor spreadsheet. The data was cleaned using SPSS data query wiza rd as a way of improving data quality and providing quality outputs during analysis. Errors and mismatches due to inconsistencies during data collection were checked and corrected; this enhanced logical consistency and quality of data for quality outputs. Data was analysed using SPSS and Microsoft Excel. Survey results and findings are presented in tables, charts and graphs reflecting project impact and outcome indicators. Figures from the PNB 2016 baseline surveys data generated are presented relative to Sierra Leone household data in the 2015 population and housing census results. The baseline survey results were supplemented by Afrobarometer Round 6 data (2015). 6
10. PAY NO BRIBE/ BASELI NE SURVEY 4 Background To Survey Data 16.1 Age, sex, education and employment/economic data were collected for all respondents (see Annex 2). It is worth noting that in all districts except Western Area and Koinadugu, significantly high proportions of respondents had never attended school. In contr ast, in Western Area and Koinadugu, over two - thirds of respondents attained primary, junior, senior or post - secondary/higher education. Unsurprisingly, the survey results also indicate that more female respondents had no education in both pilot and control districts. 17.1 Findings in relation to employment status were similar across pilot and control areas. Across survey districts, the majority of respondents were engaged in informal activities, (such as petty trading, farming, gardening, animal rearing, poult ry, etc.) and in all areas there were fewer women than men in salaried or waged work or in semi - formal skilled work such as masonry, carpentry, mechanics or driving. 18.1 All tables below are presented as percentages. Numbers are provided for tables in Annex 3 . These are extrapolated from sample numbers based on Statistics Sierra Leone 2015 population numbers in the 2015 Census. 7
6. PAY NO BRIBE/ BASELI NE SURVEY in the hand s of both bribe givers and bribe takers. Lower level officials were identified as more likely to demand/take bribes 3.1 Participants stated that bribes are most commonly paid for treatment and medicines in health; enrolment grades, promotion and report cards i n education; avoidance of more expensive connection charges with electricity and water; and for avoidance of fines or prosecutions for minor offences with the police. The survey supports these findings. Bribes are paid each time services are needed; they a re usually paid in cash but livestock and food are also used, along with sexual favours (for female beneficiaries). 4.1 Citizens rarely refuse to pay bribes as they need the services. They recognise that they should report incidents to the authorities but rare ly do so. Paradoxically they state that they have some confidence in refusing to pay and that with support from the authorities this would help reduce bribery. The consequences of refusing to pay bribes are noted as delays or blockages in receiving servic es, falling into constant trouble with the police, time wasting by officials and being hassled constantly for small offences. Conclusions The Baseline Survey demonstrates that (petty) corruption is evident across all public sectors under review. Bribe - payi ng is widespread, with respondents claiming that bribery is corruption and completely unacceptable, and that it is possibly the biggest problem in Sierra Leone. Amounts paid in bribes differ widely geographical location, rural or urban status and/or by the service required but on average petty bribe amount will always be in the region of Le 5,000 and can (rarely) be as high as Le 250,000. For poor people particularly, this can represent a significant drain on their budgets, particularly when regular health and/or education services are needed. As a general rule, higher bribes are paid in more remote areas. Despite awareness of the unacceptability of bribe - paying, there is public sympathy with public officials’ claims bribes result from them receiving their salaries or materials with which to do their jobs. Further, few citizens were prepared to oppose the paying of bribes and they had little knowledge and awareness of the Pay No Bribe programme. 3
7. PAY NO BRIBE/ BASELI NE SURVEY 2 Introduction The ‘Pay No Bribe’ (PNB) Platform is a Government of Sierra Leone (GoSL) initiative, led by the Office of the Chief of Staff and the Anti - Corruption Commission (ACC), in coordination with relevant Ministries, Departments and Agencies (MDAs). It is an outpu t of the larger Anti - Corruption Support to Sierra Leone programme run by the UK Department for International Development (DFID) which aims to tackle petty and grand corruption affecting Sierra Leone’s developmental progress. The PNB platform is an innovat ive reporting mechanism for citizens to anonymously report incidents of petty corruption and bribery. PNB is designed to collect real time evidence on bribery and corruption in five key service sectors: Education, Electricity, Health, Police and Water, and to provide a useful database on petty corruption and bribery trends to support the work of the ACC and feed into evidence - based policy decision making at the government level. This baseline survey was conducted in the four pilot PNB project districts (Bo, Kenema, Bombali and Western Area Rural and Urban). Two additional districts - Bonthe and Koinadugu - were selected as controls. Where relevant Afrobarometer Round 6 2014 - 15 survey data questions were available, findings for these were reanalysed by distri ct to provide the necessary information. Additional questions were designed to fill information gaps around specific logframe indicators. The methodology used for the additional questions was identical to that used for the regular Afrobarometer surveys. Q uantitative and qualitative methods were employed to collect data, and the approach comprised five components: 5.1 Desk review, which involved obtaining an understanding of corruption in Sierra Leone using national corruption studies, including Anti - Corruption Commission’s Perception Surveys, Transparency International and Afrobarometer reports, etc.; 6.1 Household Survey in which individuals/households were interviewed using a pre - agreed and piloted questionnaire on perceptions of corruption. 7.1 Key In formant Interviews with service providers; targeted community authorities/heads of public institutions and other related stakeholders. 8.1 Focus group discussion; involving discussions on concepts of corruption with community groups of individuals including yo uths and adults. 9.1 Analysis of related questions in the Afrobarometer Round 6 data - set, where corruption - related questions from the survey were analysed by district to provide information for relevant logframe indicators. Sample Selection 10.1 The survey was de signed using probability sampling techniques (cluster, stratified and systematic) to select the appropriate sample. This ensured that the sample would be representative. Probability proportionate to population size (PPPS) was applied for the sampling and p rovided self - weighting. Random selection was used at every stage. Sampling was carried out separately for pilot and control districts. 11.1 The sample was selected at two stages. Firstly, a sample of enumeration areas (EAs) was selected, which constituted the primary sampling unit. The list of all enumeration areas, 3 in all the six survey districts formed the sampling frame. At the second stage, ten households per sample EA were selected for interview. Due to limited listing of households, it was not possible to pre - select households for interview (the preferred method) so they were selected using ‘random walking’ in identified EAs. 12.1 For the key informant interviews, at least three community public institutions were targeted at random. Not all services are deli vered in the communities surveyed 4 therefore the target number (216) of KIIs was not achieved. Two survey EAs were randomly selected per district for the focus group discussions (FGDs) and each FGD comprised a mixed group of 7 - 12 persons. 3 as determined by Statistics Sierra Leone 4 Water/sanitation and power were the services that were not available everywhere. 4
30. PAY NO BRIBE/ BASELI NE SURVEY 8 Detailed B aseline Findings: Focus Group a nd Kii Discussions 61.1 FGD and KII Findings: overall, the discussions in the focus groups and the key informant interviews support the findings of the survey. Citizens are aware that they are being asked for bribes, and recognise that it is corruption and it is wrong. 62.1 Public services providers do acquiesce to taking bribes from citizens, and also ask for/demand them on occasions. Ho wever, they claim to do so out of shortage of money because their salaries do not arrive on time, and also due to a lack of necessary materials and/or logistics for the effective and efficient delivery of their services 10 . Focus group participants and publi c officials both stressed this point. 63.1 Shortages and/or untimely supplies of work materials were squarely blamed on central Government authorities by key informant interviewees. To date, there is relatively little or no awareness or knowledge of the ‘pay n o bribe’ (PNB) drive among citizens in the study districts. 11 64.1 Respondents perceive bribery as ‘totally unacceptable’; with submissions like: “We don’t know for public officials but for us ordinary citizens, bribery is criminal”. The study, however, revealed that public officials also believe that bribery is unacceptable, but they claim that they are driven to it through shortage of resources. 65.1 FGD participants stated that they believe it is the ‘bribe givers’ (i.e. generally citizens, the ‘victims’ of corruption) that initiate bribery and therefore have the responsibility of stopping bribery. Further discussions revealed, however, that ‘bribe takers’ (corrupt officials) usually will act in ways that create pressure on citizens to offer bribes in order t o speed up access to the service in question. Participants therefore believe that the power to stop or reduce bribery is in the hands of both service beneficiaries – bribe givers - and public officials – bribe takers. In - depth discussions brought participa nts to the conclusion that: “if the blame for bribery comes back to public officials in service delivery posts, it might just be the case that majority of them (bribe takers) are taking bribes as a result of disincentives - poor conditions of public servic es especially minimal salary levels and/or delayed salaries, on the part of Government”. 66.1 The FGDs also highlighted the fact that the health and education services for which bribes are usually paid are treatment and medicines in health; and grades for enrol ment, promotion and report cards in education. The survey further revealed that on average, between Le2,000 to Le20,000 is paid to access treatment and medicines at health centres; Le2,000 to Le5,000 for end of term report cards in education and, highest o f all, Le100,000 to Le200,000 is paid for grades and end of year promotions. 67.1 Within the power and water services sectors, bribes were found to be paid to avoid more expensive connection charges (such as buying a meter and connection fees), actually gettin g connected to the grid, getting connected to regular supply lines and maintenance. Bribe monies are usually between Le50,000 to Le250,000. 68.1 ‘Speeding up procedures and avoiding wastes of time’ were the major reasons participants stated for paying bribes a t the times they have done so. When probed about their reaction if they were asked to pay bribes for services, participants were divided between ‘paying and reporting’ and ‘paying and going about their normal businesses’. However, the majority stated ‘payi ng and going about their normal businesses’ stating ‘because there is nothing else one could do about it at the moment’ as reason. Citizens also cite bribery as a major hindrance to access to free health care and education services, and recognise that deat h can be a consequence of difficulties with accessing healthcare. 69.1 Bribes are usually paid in the form of cash, more occasionally by sexual favours (in cases of female victims) and/or in the form of food and livestock. FGD discussions indicated that while cash bribe transactions cut across all bribery situations, sexual favours occur more often between female subordinates and their male bosses in exchange for job security, or for making up for inefficiencies Sexual favours are also given between female busi ness people 10 For example, people have noted requests by the police for paper or pens to write a report or take notes of an interview or a meeting. 11 We would not necessarily expect detailed knowledge and awareness at this stage, but due to pre - Launch activities in Apr il and ongoing ACC talk - shows there could certainly be some awareness . 27
31. PAY NO BRIBE/ BASELI NE SURVEY and public officials, especially tax officials, in exchange for e.g. favourable tax discretions and other kinds of support. Also police officers and female ‘loiterers’ who are often commercial sex worker (CSWs) and other petty criminals in exch ange for their release or bail. 70.1 The FGDs revealed that more often than not, members of the public pay bribes to the police for avoidance of penalties upon breaking the law, and also, for items such as arresting and transporting suspects to the police stat ion, taking/ recording statements and for securing bail. Additionally, participants, especially business people and transport owners, insisted that special note should be taken of bribes extracted by the police in the form of ‘booking fees’. These ‘booking s’ are made each time transporters ply community routes and/or each time the services of the police are needed. 71.1 On average, between Le5,000 to Le20,000 are paid per encounter for motorbikes and Le20,000 to Le50,000 or above per encounter for other motor v ehicles. Arrests and transportations of suspects will normally attract Le20,000 and above (depending on distance), whilst taking/recording statements ‘costs’ Le5,000 to Le10,000 and securing bail is between Le100,000 and Le200,000 (depending on the alleged offence/crime). 72.1 Citizens rarely refuse to pay bribes as they need the services, often urgently in the case of health. They recognise that they should report incidents to the authorities but rarely do so. Paradoxically they state that they have some co nfidence in refusing to pay and that if they could do this with support from the authorities, it would help to reduce bribery. The consequences of refusing to pay bribes are noted as delays or blockages in receiving services, falling into constant trouble with the police, being prosecuted, time wasting by officials and being hassled constantly for small offences. 73.1 Finally, the survey and FGDs exposed a culture of bribery among people met, which could be referred to as a ‘One for All and All for One’ situati on, wherein the menace does not target anyone particularly. As long as you’re Sierra Leonean and you happen to have contact with any of the services under test or under any of the above circumstances, you might just have to pay a bribe. The discussions di d not reveal whether or not bribe givers are particularly targeted because they were of any status (male or female, young or old, employed or unemployed, rich or poor, literate or illiterate, etc.). However, to quote a participant, “Public Authority offici als may be exceptions from having to give bribes for public services when they need one”. 28
37. PAY NO BRIBE / BASEL INE REPORT Afrobarometer is produced collaboratively by social scientists from across Africa. Coordination is provided by the Centre for Democratic Development (CDD) in Ghana, the Institute for Justice and Reconciliation (IJR) in South Africa, the Institute for Devel opment Studies (IDS) at the University of Nairobi in Kenya, and the Institute for Empirical Research in Political Economy (IREEP) in Benin. Michigan State University (MSU) in the United States of America (USA) and the University of Cape Town (UCT) in South Africa provide technical support to the network. ITASCAP Ltd is the Afrobarometer national partner (NP) responsible for data collection in Sierra Leone since round 5 in 2012. 34
29. PAY NO BRIBE/ BASELI NE SURVEY 60.1 The percentage of citizens who claim to have had a discussion about corruption with family of friends in the last three months by district strata and residence is shown in Figure 14. More respondents in urban areas than rural areas claimed to have had disc ussion about corruption with family of friends. 26
24. PAY NO BRIBE/ BASELI NE SURVEY Total 100.0% 100.0% 100.0% 100.0% 100.0% 100.0% Source: Afro Barometer Round 6, 2015 21
32. PAY NO BRIBE/ BASELI NE SURVEY 9 Conclusion Through the various instruments developed, data collected led the baseline study to addressing key research questions with the following results: 74.1 Bribe - paying is widespread. All sample citizens interviewed had a good knowledge and awareness of bribery as it relates to corruption. Respondents also claimed that bribery is corruption and completely unacceptable, and that it is possibly the big gest problem in Sierra Leone. Bribes are paid each time a particular service/s is/are needed by the victims: such payments are often initiated by victim although under pressure from perpetrator. There is some sympathy with public officials’ claims not to h ave received their salaries or materials with which to do their jobs 75.1 However, the baseline exercises revealed that few citizens were prepared to oppose the paying of bribes and they had little knowledge and awareness of the Pay No Bribe programme. 76.1 Amount s paid in bribes differ widely geographical location, rural or urban status and/or by the service required. The focus groups discussions supported quantitative data generated in respect of respondents paying most bribes for, in the education sector, school enrolments/admissions and grades for end of year promotions; in the health sector, access to medicines and/treatment; in the power and water sectors, for avoiding more expensive connections/access to the grid and maintenance; and avoiding wastes of time a nd/or facing punishment in the case of the Police; 77.1 Amounts paid as bribes depend on the service required but on average petty bribe amount will always be in the region of Le 5,000 and can (rarely) be as high as Le250 , 000 . For poor people particularly, th is can represent a significant drain on their budgets, particularly when regular health and/or education services are needed. 78.1 As a general rule, higher bribes are paid in more remote areas. There are exceptions to this, but it is clear that respondents li ving in control districts and in the rural areas of the pilot districts paid more overall in bribes. This may be due to the respondents’ own lack of awareness/education, or perhaps due to greater pressure on more scarce resources. 79.1 Finally, the PNB 2016 Ba seline Surveys conclude that that (petty) corruption is evident across public sectors under review in all study domains. This is supported by the Afrobarometer round 6 – 2015/16 Surveys in Sierra Leone where respondents were asked: ‘ In your opinion, over t he past year, has the level of corruption in this country increased, decreased, or stayed the same?’ M ore than 80% of respondents said corruption has ‘increased a lot’, ‘increased somewhat’, or ‘stayed the same’. 29
25. PAY NO BRIBE/ BASELI NE SURVEY 7 Detailed Baseline Findings by Logframe Indicator: Output Level 51.1 Output Indicator 3.3: Number/Percentage of m/f citizens in programme areas who can describe one or more ways of reporting a bribe: given PNB had scarcely started when the baseline was ca rried out, few respondents were able to describe ways of reporting a bribe. More people in pilot districts were able to respond (24.8%) than control ones (18.7%), however, possibly because a few PNB/ACC activities had already been initiated in the pilot ar eas. In both pilot and control areas more men than women were able to describe ways of reporting a bribe as Figure 11 shows. 52.1 Table 19 shows percentage of citizens who can describe one or more ways of reporting a bribe by me thod and gender in pilot and control districts. Overall, a favoured method mentioned by both sexes in pilot districts was through a Civil Society Organization (CSO) at 11.3%. In control districts, SMS was identified as a way of reporting a bribe (10.4%). 9 Table 19: Percentage of male/female citizens in pilot and control districts who can describe one or more ways of reporting a bribe Ways of reporting a bribe Pilot districts Control districts Male Female Total Male Female Total Calling a hotline phone number (515) 12.3% 7.0% 9.6% 6.6% 3.3% 5.0% By email 0.4% 0.0% 0.2% 0.0% 0.8% 0.4% By SMS 8.1% 6.2% 7.1% 14.0% 6.7% 10.4% Through Civil Society Organization (CSO) partner organization 11.4% 11.1% 11.3% 7.4% 5.0% 6.2% 9 In fact, PNB will not now be using texts as a way to report bribery. 22
41. PAY NO BRIBE / BASEL INE SURVEY Sample: pilot districts = 294; control districts = 157; rural = 308, urban = 143 38
26. PAY NO BRIBE/ BASELI NE SURVEY % Persons who describe one or more ways of reporting a bribe 28.4% 21.4% 24.8% 23.1% 14.2% 18.7% Source: PNB Baseline, 2016 53.1 Table 20 highlights percentages of citizens disaggregated by age who can describe ways of reporting a bribe. Findings indicate that youth res pondents were less informed in pilot and control districts, but the least informed group was the 36 - 49 years in control districts (13.0%) Table 20: Percentage of citizens who can describe ways of reporting a bribe by district strata and age Ways of reporting a bribe District Strata & Age (years) Pilot districts Control districts (18 - 35) years (36 - 49) years (50 +) years (18 - 35) years (36 - 49) years (50 +) years Calling a hotline phone number (515) 8.6% 12.4% 7.5% 6.3% 3.3% 5.4% By email 15.0% 13.7% 18.9% 0.9% 0.0% 0.0% By SMS 2.3% 5.2% 0.0% 11.6% 6.5% 18.9% Through Civil Society Organization (CSO) partner organization 0.5% 0.7% 0.0% 7.1% 5.4% 5.4% Persons who describe one or more ways of reporting a bribe 23.6% 25.5% 26.4% 20.5% 13.0% 27.0% Source: PNB Baseline, 2016 54.1 The percentages of rural/urban citizens who can describe ways of reporting a bribe in pilot and control districts are shown in Figure 12. In pilot districts, results are similar, but urban residents are significantly more inform ed in the control districts. 55.1 Output Indicator 4.3 Number/Percentage of citizens who know about ACC's work on grand corruption and can describe one or more cases: Men and women respondents were asked to describe one or more g rand corruption cases. Findings show that 83.8% of respondents in pilot districts had information about ACC’s work on grand 23
48. PAY NO BRIBE / BASEL INE REPORT None - 5,808 7,718 8,701 2,760 - Some of them 25,239 40,381 28,863 70,886 9,596 23,700 Most of them 34,254 28,857 27,911 78,563 17,790 39,574 All of them 22,535 14,382 40,387 92,382 12,313 10,558 Don't know/Haven't heard enough 30,648 2,858 952 5,374 - - Total 112,676 92,195 105,725 255,906 42,458 73,833 Table 18: Difficulty to obtain help from the police (Number of people) Table 19: Frequency of paying a bribe to avoid problem with police (Number of people) Table 20: Payment of bribe to police for assistance/services by district (Number of people) Difficulty Pilot districts Control districts Kenema Bombali Bo Western Area Bonthe Koinadugu Very Easy 1,803 - 8,669 14,075 4,118 - Easy 1,803 5,808 - 12,795 2,760 3,987 Difficult - 8,666 8,669 33,268 9,596 10,558 Very Difficult - 5,808 6,766 32,244 1,359 - No contact 108,169 72,004 81,725 163,524 24,668 59,362 Don't Know 901 - - - - - Total 112,676 92,195 105,725 255,906 42,458 73,833 Frequency Pilot districts Control districts Kenema Bombali Bo Western Area Bonthe Koinadugu Missing - - - 5,374 - - Never 3,606 7,652 8,669 25,847 4,118 6,571 Once or Twice - 10,602 2,855 16,122 5,477 7,900 A Few times - 1,936 - 15,098 1,359 - Often - - 12,476 30,197 6,836 - No contact 108,169 72,004 81,725 163,524 24,668 59,362 Don’t know 901 - - - - - Total 112,676 92,195 105,725 255,906 42,458 73,833 45
51. PAY NO BRIBE / BASEL INE REPORT Tackle corruption 101,524 220,582 308,888 19,904 7,373 24,754 Accept the need for transparency, accountability 22,027 57,129 74,266 2,654 - 3,131 Prosecute corrupt practices 65,585 164,722 216,174 12,700 2,458 15,421 Enhance a corrupt free society 26,168 115,528 123,461 7,203 3,686 9,160 % citizens who know about ACC's work on grand corruption and can describe one or more cases 165,618 317,384 473,029 47,390 12,288 57,973 Table 26: Percentage of citizens who claim to have listened to/read information on anti - corruption in the previous 3 months by district strata and residence Pilot districts Control districts Source of information Rural Urban Total Rural Urban Total PNB website 558 915 1,466 231 - 255 News papers 6,970 17,148 23,091 1,106 819 1,467 Radio 84,754 137,871 221,749 4,242 2,458 5,422 ACC education and publicity campaigns. 6,412 11,432 17,593 1,003 819 1,308 Word of mouth 10,455 25,837 34,454 4,011 - 4,753 No. of citizens who claim to have listened to/read information on anti - corruption in the previous 3 months 139,399 228,642 366,527 25,710 8,192 31,897 48
4. PAY NO BRIBE/ BASELI NE SURVEY 1 Executive Summary The ‘Pay No Bribe’ (PNB) Platform is a Government of Sierra Leone (GoSL ) initiative, led by the Office of the Chief of Staff and the Anti - Corruption Commission (ACC), in coordination with relevant Ministries, Departments and Agencies (MDAs). It is an output of the larger Anti - Corruption Support to Sierra Leone programme run b y the UK Department for International Development (DFID) which aims to tackle petty and grand corruption affecting Sierra Leone’s developmental progress. The PNB platform is an innovative reporting mechanism for citizens to anonymously report incidents of petty corruption and bribery. PNB is designed to collect real time evidence on bribery and corruption in five key service sectors: Education, Electricity, Health, Police and Focus Group Discussions Water, and to provide a useful database on petty corrupti on and bribery trends to support the work of the ACC and feed into evidence - based policy decision making at the government level. The baseline survey was conducted in four pilot PNB districts (Bo, Kenema, Bombali, Western Area Rural + Urban) and two contro l districts - Bonthe and Koinadugu. Relevant Afrobarometer Round 6 2014 - 15 survey data was reanalysed by district to provide information for some questions. The survey was designed to fill information gaps around specific logframe indicators, and both quan titative and qualitative methods were employed. Probability sampling techniques were used to select a representative sample. Random selection was used at every stage and sampling was done separately for pilot and control districts. There were 720 respond ents, 479 in pilot districts and 241 in control districts, approximately half male and half female. Age, sex, education and economic data were collected for all respondents. Many people had little or no schooling, especially outsid e of Western Area and Koi nadugu and fewer women than men had ever attended school. Employment status of respondents was similar across pilot and control districts. The majority were engaged in informal activities (petty trading etc.) and i n all areas there were fewer women than me n in waged work or in semi - formal skilled work such as carpentry. Baseline findings Impact Indicator 1: Education For education, payment of bribes for school enrolment was explored. Across pilot districts, 48.6% of respondents overall confirmed having paid a bribe to place their children in schools (the highest being Bombali at 63.6%) whilst 64.4% had done so in control districts (the highest being Bonthe at 64.7%). Most respondents had paid Le 20,000 or less. Impact Indicator 1: Health For health, question s focused on the three health services areas in public hospitals/PHUs that are provided free under the Free Health Care (FHC) initiative. These are under - five (U5) child health care, and antenatal and postnatal care. The average percentage of people payin g bribes for health services in control districts (67.2%) is almost twice the average in pilot districts (36.6%). Among pilot districts, Bombali registered a higher percentage of respondents (57.0%) who had paid bribes , and Western Area recorded the lowest (15.0%). P ayments for health services were higher in rural than in urban areas for both pilot and control districts. M ore respondents paid for U5 child health than any other health service in all districts; and across all districts most people who paid br ibes gave Le 50,000 or less. Impact Indicator 1: Water and Sanitation Questions focused on extra payments to water companies, government or service provider officials to obtain water. Control districts have almost no access to piped water. In pilot distric ts, 19.8% of respondents paid extra to get water, which breaks down to 23.8% urban and 15.8% rural. Urban costs were largely for water from tap/piped sources and rural costs were for wells with hand pumps. By district, people in Western Area paid mainly fo r tap/piped water and people in remaining districts paid for water from wells with hand pumps. Outside of Western Area, most people paid less than Le 5,000, but in Western Area, 70.0% of respondents paid between Le 20,000 and Le50,000 or between Le 100,000 and Le 500,000. Impact Indicator 1: Electricity For electricity, questions focused on additional costs for (re)connection or related services paid to a national electricity generation/grid or distribution company. National electricity is available only in headquarter cities of of pilot districts 1
11. PAY NO BRIBE/ BASELI NE SURVEY 5 Detailed Baseline Findings By Logframe Indicator: Impact Level 19.1 Impact Indicator 1: Percentage of people who paid a bribe to access services in selected sectors: Respondents were asked whether or not they had ever paid a bribe to access public services in five selected sectors namely education, health, electricity, wat er & sanitation and police. They were asked to respond by sector over the previous 12 months, prior to the survey. 20.1 Respondents who had paid a bribe to access services in the five selected sectors, were further asked to indicate the amount that had been pa id in each instance. Amounts paid were in local currency, and within specified ranges. Impact Indicator 1: Education Sector 21.1 In education, payment of bribes was limited to asking respondents about extra payments in relation to enrolment of children in public ( i.e. state) schools 5 . In all pilot districts, 48.6% of respondents (225/463) confirmed having paid a bribe for their children in schools whilst 64.4% (145/225) paid a bribe in control districts. 22.1 Analysis of pilot districts ranked Bombali as the hi ghest, with 63.6% of respondents reporting that they had paid a bribe for school placement, whilst Western Area registered lowest (39.0%). Among control districts, more respondents had paid a bribe than any of the pilot districts as Figure 4 shows. 23.1 Higher numbers of bribes paid in control districts could be associated with a lower availability of schools and perhaps lower awareness compared to pilot districts. Sample: Bo=90, Bombali=88, Kenema=108, West=177, Bonthe=85, Koinadugu=140 24.1 Interestingly the Afro barometer data (2015) registered fewer respondents paying bribes - once/twice, a few times or often – for school services as shown in Table 1 below. This is low compared with payment for placement (enrolment) of children in school in 2016 recorded in this survey. The lower percentage could be explained by the shutdown of school activities during the Afrobarometer survey, as part of the response to the Ebola outbreak. Table 1: Frequency of paying bribe for school services 5 Bribes are also commonly paid for (annual) school report cards, graduation to the next level and procurement of favourable exam r esults. Difficulty Pilot districts Control districts 8
46. PAY NO BRIBE / BASEL INE REPORT Table 12: Payment of bribe to access water by district (Number of people) Amount paid (SLL) Pilot districts Control districts Bo Bombali Kenema Western Area Bonthe Koinadugu Less than Le5,000 28,229 37,847 67,413 - - - Le5,000 < Le20,000 899 7,304 7,078 415 - 483 Le20,000 < Le50,000 899 20,417 17,752 - - - Le50,000 < Le100,000 899 - 1,236 - - - Le100,000 < Le500,000 3,632 16,019 17,752 - - - Le500,000 < Le1,000,000 - 1,494 1,236 - - - Total 34,595 82,998 112,354 415 - 483 Table 13: Payment of bribe to access water by rural/urban residence (Number of people) Table 14: Payment of bribe to access electricity from national grid by district (Number of people) Amount paid (SLL) Pilot districts Control districts Rural Urban Total Rural Urban Total Less than Le5,000 28,229 37,847 67,413 - - - Le5,000 - Le20,000 899 7,304 7,078 415 - 483 Le20,000 - Le50,000 899 20,417 17,752 - - - Le50,000 - Le100,000 899 - 1,236 - - - Le100,000 - Le500,000 3,632 16,019 17,752 - - - Le500,000 - Le1,000,000 - 1,494 1,236 - - - Total 34,595 82,998 112,354 415 - 483 Amount paid (SLL) Pilot districts Control districts Rural Urban Total Rural Urban Total Less than Le5,000 2,646 - 14,099 - - - Le5,000 < Le20,000 5,292 3,838 9,399 1,565 - - Le20,000 < Le50,000 5,292 7,687 - 3,656 - - Le50,000 < Le100,000 2,646 - 4,700 1,565 - - 43
49. PAY NO BRIBE / BASEL INE REPORT Amount paid (SLL) Pilot districts Control districts Rural Urban Total Rural Urban Total Less than Le5,000 2,109 12,293 15,775 2,326 8,455 1,335 Le5,000 - Le20,000 7,406 11,279 21,033 11,632 12,328 7,431 Le20,000 - Le50,000 - 5,132 7,887 23,264 5,837 2,682 Le50,000 - Le100,000 1,063 1,014 5,258 39,549 - 366 Le100,000 - Le500,000 4,234 1,014 2,629 9,306 655 - Le500,000 - Le1,000,000 1,063 - - 4,653 - - Above Le1,000,000 - - - 2,326 - - Total 15,859 30,732 52,582 93,057 27,274 11,813 Table 21: Payment of bribe to police for assistance/services by rural/urban residence (No. of people) Amount paid (SLL) Pilot districts Control districts Rural Urban Total Rural Urban Total Less than Le5,000 11,835 20,409 31,932 9,986 - 11,615 Le5,000 - Le20,000 16,380 30,613 46,124 33,249 - 38,674 Le20,000 - Le50,000 5,444 21,791 24,836 12,873 - 14,973 Le50,000 - Le100,000 8,190 20,409 27,202 1,270 - 1,477 Le100,000 - Le500,000 4,545 8,716 13,009 404 - 470 Le500,000 - Le1,000,000 899 2,870 3,548 - - - Above Le1,000,000 - 1,488 1,183 - - - Total 47,340 106,296 147,835 57,725 - 67,142 Table 22: Effectiveness of the news media to reveal government mistakes and corruption (No. of people) Effectiveness Pilot districts Control districts Kenema Bombali Bo Western Area Bonthe Koinadugu Not at all effective 2,704 5,808 10,573 40,945 - 3,987 Not very effective 10,817 11,524 24,951 79,587 9,596 5,242 Somewhat effective 14,423 18,255 47,048 41,969 10,954 2,658 46
50. PAY NO BRIBE / BASEL INE REPORT Very effective 13,521 31,715 14,379 81,634 12,313 35,588 Don't know 71,211 24,985 8,669 11,772 9,596 26,358 Total 112,676 92,195 105,725 255,906 42,458 73,833 Table 23: People can fight corruption (No. of people) Table 24: Number of citizens who can describe ways of reporting a bribe by district strata and residence Ways of reporting a bribe Pilot district Control district Rural Urban Total Rural Urban Total Calling a hotline phone number (515) 3,692 10,906 13,487 908 - 1,088 By email - 361 281 70 - 87 By SMS 1,716 9,825 9,975 1,746 1,843 2,351 Through Civil Society Organization (CSO) partner organization 7,800 6,760 15,876 1,135 - 1,350 Persons who describe one or more ways of reporting a bribe 52,001 90,134 140,492 17,459 6,144 21,769 Table 25: Number of citizens who know about ACC's work on grand corruption and can describe one or more cases by district strata and residence Pilot districts Control districts Work on grand corruption Rural Urban Total Rural Urban Total Strength Pilot districts Control districts Kenema Bombali Bo Western Area Bonthe Koinadugu Missing - - 952 - - - Strongly Disagree 25,239 25,907 48,105 79,587 17,790 18,458 Disagree 10,817 10,602 16,387 25,847 5,477 5,242 Neither Agree nor Disagree 15,324 2,858 14,379 22,520 2,760 1,329 Agree 16,225 20,191 4,758 46,319 10,954 31,674 Strongly Agree 4,507 18,255 15,330 76,260 2,760 13,216 Don’t Know 40,563 14,382 5,815 5,374 2,760 3,987 Total 112,676 92,195 105,725 255,906 42,458 73,833 47
42. PAY NO BRIBE / BASEL INE REPORT Annex 3 : Extrapolated Numbers for all Tables Numbers for Related Tables in Main Report Table 1: Numbers of people having difficulty to obtain public school services Difficulty Pilot districts Control districts Kenema Bombali Bo Western Area Bonthe Koinadugu Very Easy 11,718 6,723 45,173 82,793 19,175 3,955 Easy 13,521 16,326 30,756 44,085 9,587 17,140 Difficult 5,408 13,445 7,689 32,257 5,478 6,592 Very Difficult 3,606 2,881 961 31,182 - 2,637 No contact 77,521 50,899 21,145 64,514 8,218 43,509 Don't Know 901 1,921 - 1,075 - - Total 112,676 92,195 105,725 255,906 42,458 73,833 Table 2: Frequency of paying bribe for school services (Number of people) Difficulty Pilot districts Control districts Kenema Bombali Bo Western Area Bonthe Koinadugu Missing 5,408 4,802 3,845 15,053 - 2,637 Never 28,845 24,009 66,318 136,555 28,762 25,050 Once or Twice - 7,683 2,883 12,903 2,739 2,637 A Few times - 960 5,767 9,677 2,739 - Often - 1,921 5,767 16,129 - - No contact 77,521 50,899 21,145 64,514 8,218 43,509 Don’t know 901 1,921 - 1,075 - - Total 112,676 92,195 105,725 255,906 42,458 73,833 Table 3 : Payment of bribery to access services in Education by district (Number of people) Amount paid (SLL) Pilot districts Control districts Less than Le5,000 30,524 25,130 26,056 23,143 6,992 7,385 39
43. PAY NO BRIBE / BASEL INE REPORT Le5,000 < Le20,000 19,958 23,036 19,803 27,482 11,987 29,540 Le20,000 < Le50,000 4,696 5,235 4,169 20,250 5,494 9,495 Le50,000 < Le100,000 - 4,188 2,085 20,250 2,497 1,055 Le100,000 < Le500,000 1,174 1,047 2,085 8,679 499 - Total 56,351 58,636 54,197 99,803 27,470 47,475 Table 4: Number of people who paid extra cost for the various health services by district Amount paid (SLL) Pilot districts Control districts Bo Bombali Kenema Western Area Bonthe Koinadugu Under five child health care 13,406 19,943 17,274 2,890 9,110 10,668 Antenatal care (for pregnant women) 3,754 9,307 10,858 1,778 5,531 10,668 Postnatal care (for lactating mothers) 1,609 13,960 1,974 222 8,784 7,227 Others 4,826 3,324 3,455 1,112 5,531 7,915 No. of people paying bribe at public clinic/hospital 48,796 52,516 54,289 38,460 28,305 49,901 Table 5: Number of people who paid extra cost for the various health services by rural/urban residence Amount paid (SLL) Pilot districts Control districts Rural Urban Total Rural Urban Total Under five child health care 21,482 23,123 46,125 16,589 4,915 20,513 Antenatal care (for pregnant women) 13,191 14,075 28,213 17,796 1,229 20,861 Postnatal care (for lactating mothers) 4,523 8,546 12,987 14,478 - 16,689 Others 4,899 6,535 11,643 11,160 3,686 13,907 No. of people paying bribe at public clinic/hospital 86,305 117,627 207,340 64,849 12,288 78,228 Table 6: Numbers of people having difficulty to obtain medical treatment Difficulty Pilot districts Control districts Kenema Bombali Bo Western Area Bonthe Koinadugu Very Easy 13,521 4,802 49,018 61,288 15,066 7,911 40
44. PAY NO BRIBE / BASEL INE REPORT Table 7: Frequency of paying bribe for treatment at public clinic or hospital (Number of people) Table 8: Payment of bribery to access health services by district (Number of people) Easy 9,915 17,287 25,951 38,708 10,957 22,414 Difficult 4,507 12,485 10,573 38,708 8,218 3,955 Very Difficult 1,803 960 961 47,310 1,370 5,274 No contact 82,028 55,701 19,223 69,890 6,848 34,280 Don't Know 901 960 - - - - Total 112,676 92,195 105,725 255,906 42,458 73,833 Frequency Pilot districts Control districts Kenema Bombali Bo Western Area Bonthe Koinadugu Missing 1,803 1,921 961 5,376 - 1,318 Never 25,239 26,890 70,163 122,577 27,392 36,917 Once or Twice 1,803 4,802 3,845 9,677 1,370 - A Few times 901 960 961 17,204 4,109 1,318 Often - 960 10,573 31,182 2,739 - No contact 82,028 55,701 19,223 69,890 6,848 34,280 Don’t know 901 960 - - - - Total 112,676 92,195 105,725 255,906 42,458 73,833 Amount paid (SLL) Pilot districts Control districts Bo Bombali Kenema Western Area Bonthe Koinadugu Less than Le5,000 6,971 12,837 9,219 - 1,952 4,074 Le5,000 < Le20,000 27,884 26,842 15,365 22,188 12,201 26,987 Le20,000 < Le50,000 10,456 10,503 12,292 11,834 7,320 18,331 Le50,000 < Le100,000 2,324 2,334 10,243 1,479 3,904 509 Le100,000 < Le500,000 1,162 - 7,170 - 2,440 - Le500,000 < Le1,000,000 - - - 1,479 - - Above Le1,000,000 - - - 1,479 488 - Total 48,796 52,516 54,289 38,460 28,305 49,901 41
47. PAY NO BRIBE / BASEL INE REPORT Table 15: Payment of bribe to access electricity from national grid by rural/urban residence (Number of people) Table 16: Extent of trust in the police (Number of people) Table 17: Involvement of police in corruption (Number of people) Level of trust Pilot districts Control districts Kenema Bombali Bo Western Area Bonthe Koinadugu Le100,000 < Le500,000 2,646 - 4,700 - - - Le500,000 < Le1,000,000 - - - 519 - - Total 18,502 11,524 32,864 7,312 - - Amount paid (SLL) Pilot districts Control districts Rural Urban Total Rural Urban Total Less than Le5,000 5,526 4,466 9,640 - - - Le5,000 < Le20,000 5,526 13,398 19,280 - - - Le20,000 < Le50,000 8,289 17,864 26,529 - - - Le50,000 < Le100,000 2,763 8,932 12,032 - - - Le100,000 < Le500,000 2,763 2,209 4,857 - - - Le500,000 < Le1,000,000 - 2,209 2,391 - - - Total 24,892 49,078 74,730 - - - Level of trust Pilot districts Control districts Rural Urban Total Rural Urban Total Not at all 20,732 41,303 38,484 138,701 12,313 44,817 Just a little 27,042 23,971 28,863 48,366 23,267 14,471 Somewhat 24,338 19,177 21,145 27,894 4,118 9,229 A lot 25,239 6,730 16,387 39,665 2,760 5,242 Don't know/Haven't heard enough 15,324 922 952 1,024 - - Total 112,676 92,195 105,725 255,906 42,458 73,833 44
5. PAY NO BRIBE/ BASELI NE SURVEY and adjacent rural areas, and not in the control districts. Overall, 13.2% of respondents across pilot districts confirmed paying additional costs for electricity. Kenema district accounted for highest proportion o f extra payments, while Western Area recorded the lowest (2.9%). There were marked geographical differences in amounts paid: 42.9% of respondents in Kenema paid less than Le5,000, whereas respondents in Bombali and Western Area (66.7% and 50.0% respectivel y) paid between Le20,000 and Le50,000 for the same services. Impact Indicator 1: Police Questions focused on payments to police officers for assistance and/or services or problem avoidance. 1 26.1% of respondents in all pilot districts had paid a police officer, but more than twice this (57.7%) reported payments in control districts. Koinadugu district recorded the highest incidence at 64.2%. By urban/rural residence, 30.5% of respondents in u rban and 21.7% in rural areas had paid police in pilot districts. Payments were largely between Le 5,000 - Le 20,000 in all areas, except Western where 60% paid above Le 50,000. Citizens’ trust in the police was lower in Western Area and Koinadugu, where mor e than 50% of respondents stated that they had no trust at all in the police. Across all districts except Kenema, more than 50% of respondents claimed to have no trust or just a little trust. In Kenema more than 20% of people claimed to have a lot of tru st in the police. Outcome Indicator 3: Making a difference to corruption and effectiveness of media Questions focused on i) whether people think that they can make a difference to corruption and ii) the effectiveness of the media in revealing corruption. Results varied by district: only 18.4% of respondents in Kenema agreed or strongly agreed that ordinary people can make a difference, whereas 60.8% of respondents in Koinadugu agreed or strongly agreed. Respondents in Bo (61.0%) and Bonthe (54.8%) disagree d or strongly disagreed with the statement. Around 50% of respondents in all districts except Kenema felt that the media are effective at revealing government mistakes and corruption. Output Indicator 2.3: Reporting a bribe Questions asked whether people c ould describe one or more ways of reporting a bribe. Few people were able to , given the newness of PNB, but more people in pilot areas respond ed (24.8%) than in control areas (18.7%), possibly because some ACC activities were ongoing in pilot areas. M ore m en than women were able to describe ways of reporting a bribe. Output Indicator 4.2: Accessing information on corruption Questions focused on whether respondents had listened to or read information on corruption in the previous 3 months. There were differ ences between pilot districts (64.7% had accessed information) and control districts (27.4%) and between men and women in pilot areas (70.3%m; 59.3%f) and in control areas (36.4%m; 18.3%f). Radio was identified as the most popular source of information. O utput Indicator 4.2: Discussing corruption with family/friends Questions covered citizens who stated they had had a discussion about corruption with family/ friends in the last three months by ( gender and pilot/control district ) . Overall, m ore people in pi lot areas (26.9%) than control areas (14.9%) had such discussions and more men than women in pilot areas (33.9%m; 20.2%f) and in similarly in control areas (21.5%m; 8.3%f). Focus Groups and Key Informant Interviews 1.1 Overall, Focus Group Discussions (FGDs) and key informant interviews support the findings of the survey. Citizens are aware that paying bribes is wrong, and that it is partly their responsibility to stop it. Public service officials also recognise asking for bribes wrong, but they claim that th ey have to do it due to shortages of money (salaries arrive late) and/or due to shortages of materials and/or logistics needed for them to do their jobs. 2 Such delays and shortages were blamed on central Government authorities by key informant interviewees . 2.1 FGD participants stated that it is the ‘bribe givers’ (i.e. citizens) that initiate bribery but that the ‘bribe takers’ (public officials) usually create pressure on citizens to offer bribes. The power to stop or reduce bribery is therefore 1 For example, passing through a checkpoint or avoiding a fine or arrest 2 For example, people have noted requests by the police for paper or pens to write a report or take notes of an interview or a meeting. 2
36. PAY NO BRIBE / BASEL INE REPORT Pre - test of Survey Tools Following the training of data collectors, the survey tools (questionnaires) were pretested in one (1) day before finally adopting for actual fieldwork/data collection. Th e essence of pre - testing the questionnaires was to test the appropriateness of the questionnaires for use in collecting the baseline data. Data Collection Methods Data collection lasted for a period of ten (10) days. The data collectors worked as a team t o collect the baseline data; two (2) enumerators and one (1) supervisor per district. The enumerators administered the household and key informant interview questionnaires while the supervisors, in conjunction with the field coordinators / lead consultants led the focus group discussions; when it was observed during training that the FGDs were more intricate than initially thought. The supervisors vetted all completed questionnaires to ensure completeness and quality of data collected. In addition, the lea d Consultants provided overall oversight coordination to the fieldwork. Every instruction was applied to ensure ‘unbiased’ sample/respondent selection; giving every sample unit equal chance to be selected and thus yielding a representative sample of the re search population. Data Quality Assurance Data quality was guaranteed at all levels of the baseline design and implementation. At the design stage, it was ensured that qualified and experienced persons were recruited to serve as enumerators and supervisors . The questionnaires were well - structured to be able to capture all relevant data for baseline survey. Thorough instructions were provided during training sessions to enable data collectors (enumerators and supervisor) understand the survey questions and q uestionnaires. Appropriate translations of questions and/or key words were provided into the respective local languages that enhanced accurate data collected. And demonstration/role play during training reinforced data collectors’ skills in administration of the questionnaires. Every effort was employed to provide ‘unbiased’ sample; giving every sample unit equal chance to be selected and thus yielding a representative sample of the research population. Field - level supervision was emphasized; the supervisor s closely worked with the enumerators in survey communities and ensured that all completed questionnaires are checked for completeness, edited and possible errors corrected with the respondents in the field. By providing overall coordination of the data co llection, the consultant ensured that high quality data is collected. All completed questionnaires were coded in preparation of data collected to be effectively computerized thus achieving an enhanced database. The computerized data was thoroughly cleaned to ensure data quality. Confidentiality during field data collection was maintained. And all data collected were kept in secret and not divulged to any third party. Data Processing, Entry, Analysis and Reporting Four (4) data entry clerks were hired a nd trained to enter data. Data was entered in Statistical Package for the Social Sciences (SPSS) data entry editor spreadsheet. The data was cleaned using SPSS data query wizard as a way of improving data quality and providing quality outputs during analys is. Errors and mismatches due to inconsistencies during data collection were checked and corrected; this enhanced logical consistency and quality of data for quality outputs. Data was analysed using SPSS software package and Microsoft Excel. Survey results and findings are presented in tables, charts and graphs reflecting project impact and outcome indicators. This draft survey report is therefore submitted to Coffey International for review; and final survey report is produced upon feedback/comments on the draft report. The numbers of respondents interviewed for each domain are presented in parentheses of analytical tables and footnotes of charts (figures) to be able to perceive the numbers for indicators. Figures from the PNB 2016 baseline surveys data g enerated are presented relativ e to the Sierra Leone household data in the 2015 population and housing census results. The baseline survey results were supplemented ( Annex 5 - Additional Information ) by Afrobarometer (AB) round 6 data (2015). The Afrobaromete r is an African - led, non - partisan research network that conducts public attitude surveys on democracy, governance, economic conditions, and related issues in more than 30 countries in Africa. Five rounds of surveys were conducted between 1999 and 2013, and Round 6 surveys (adopted in this baseline) were carried out in 2014 - 2015. Afrobarometer conducts face - to - face interviews in the language of the respondent’s choice with nationally representative samples of between 1,200 and 2,400 respondents. 33
13. PAY NO BRIBE/ BASELI NE SURVEY Sample: Pilot districts = 225; control districts =145 Impact Indicator 1: Health Sector 27.1 For the health sector, the survey focused on extra payments for consultation or medication for household/family member to a health worker in a government hospital and/or peripheral health unit (PHU)/clinic. For the purpose of the survey, the three health services areas in the public hospital/clinic that are provided free under the ‘F ree Health Care (FHC) initiative were investigated. In Sierra Leone, the FHC mandates under - five child health care, antenatal care (for pregnant women) and postnatal care (lactating mothers) as free of cost. 28.1 The findings highlight that the average percent age of people paying bribes for health services in control districts (67.2%) is almost twice as high as the average in pilot districts (36.6%). Across the pilot districts, Bombali registered a higher percentage of respondents (57.0%) who had paid extra for health services, while Western Area recorded the least (15.0%). The two control districts accounted for the highest percentages of respondents that paid extra cost, see Figure 6 below. Sample: Bo=91, Bombali=79, Kenema=110, West=173, Bonthe=87, Koinadugu=145 29.1 Extra payments for health services were higher in rural areas than in urban areas for both pilot and control districts. Within the pilot districts, slightly more respondents in rural areas (39.5%: 90/228) were said to have paid 40.4 34.2 12.0 8.9 4.4 19.3 55.2 20.0 4.8 0.7 0.0 10.0 20.0 30.0 40.0 50.0 60.0 < Le5,000 Le5,000 < Le20,000 Le20,000 < Le50,000 Le50,000 < Le100,000 Le100,000 < Le500,000 Percent (%) Amount paid (SLL) Figure 5: Payment of bribery to access services in Education by district strata Pilot district Control district 46.2% 57.0% 48.2% 15.0% 66.7% 67.6% 0.0% 10.0% 20.0% 30.0% 40.0% 50.0% 60.0% 70.0% 80.0% Bo Bombali Kenema Western Area Bonthe Koinadugu Pilot districts Control districts % respondents District Figure 6: Percentage of people who paid extra cost for consultation or medication for household/family member to a health worker in a government hospitals and/or peripheral health units (PHUs)/clinicsby district 10
28. PAY NO BRIBE/ BASELI NE SURVEY Pilot districts Control districts Source of information Male Female Total Male Female Total PNB website 0.8% 0.0% 0.4% 0.8% 0.8% 0.8% News papers 7.2% 5.3% 6.3% 7.4% 1.7% 4.6% Radio 66.1% 55.1% 60.5% 23.1% 12.5% 17.8% ACC education and publicity campaigns. 6.8% 2.9% 4.8% 6.6% 1.7% 4.1% Word of mouth 7.2% 11.5% 9.4% 19.8% 10.0% 14.9% % citizens who claim to have listened to/read information on anti - corruption in the previous 3 months 70.3% 59.3% 64.7% 36.4% 18.3% 27.4% 58.1 There are greater differences in citizens’ knowledge about anti - corruption between pilot and control districts with regards to rural and urban residence. In pilot districts as Table 24 shows, there are only small differences between rural areas (63.8%) and urban areas (65.7%) whereas in control districts the percentages are 26.8% rural and 40.0% urban. Table 24: Percentage of citizens who claim to have listened to/read information on anti - corruption in the previous 3 months by district strata and residence Pilot districts Control districts Source of information Rural Urban Total Rural Urban Total PNB website 0.4% 0.4% 0.4% 0.9% 0.0% 0.8% News papers 5.0% 7.5% 6.3% 4.3% 10.0% 4.6% Radio 60.8% 60.3% 60.5% 16.5% 30.0% 17.0% ACC education and publicity campaigns. 4.6% 5.0% 4.8% 3.9% 10.0% 4.1% Word of mouth 7.5% 11.3% 9.4% 15.6% 0.0% 14.9% % citizens who claim to have listened to/read information on anti - corruption in previous 3 months 63.8% 65.7% 64.7% 26.8% 40.0% 27.4% Source: PNB Baseline, 2016 59.1 Output Indicator 5.4, Number/Percentage of citizens claiming to have had a discussion about corruption with family/friends in the last 3 months: Figure 13 presents citizens who claim to have had a discussion about corruption with family/ fri ends in the last three months by gender and pilot/control district. More male respondents than females across pilot and control districts had had these discussions. 25
45. PAY NO BRIBE / BASEL INE REPORT Table 9: Payment of bribe to access health services by rural/urban residence (Number of people) Amount paid (SLL) Pilot district Control districts Rural Urban Rural Urban Less than Le5,000 9,589 24,764 4,323 4,096 Le5,000 < Le20,000 39,317 55,718 32,425 6,144 Le20,000 < Le50,000 23,015 21,668 21,616 2,048 Le50,000 < Le100,000 9,589 7,739 3,891 - Le100,000 < Le500,000 4,795 4,643 2,162 - Le500,000 < Le1,000,000 - 1,548 - - Above Le1,000,000 - 1,548 432 - Total 86,305 117,627 64,849 12,288 Table 10: Main water source for which people had paid extra cost for water by district (Number of people) Main source Pilot districts Control districts Bo Bombali Kenema Western Area ) Bonthe Koinadugu Tap/pipe borne 1,057 - 11,273 13,819 - 489 Hand pump well 4,229 13,313 16,385 3,583 - - Ordinary well - 4,107 4,096 3,071 - - River/Stream - 2,044 - - - - No. of people paying bribe to access water 5,286 19,463 31,754 20,472 - 489 Table 11: Number of people who had paid extra cost for water by rural/urban residence Main source Pilot districts Control districts Rural Urban Total Rural Urban Total Tap/pipe borne 8,199 43,657 46,178 - - 483 Hand pump well 20,030 26,227 47,301 - - - Ordinary well 4,532 13,114 16,516 - - - River/Stream 1,834 - 2,359 - - - Total 34,595 82,998 112,354 - - 483 42
16. PAY NO BRIBE/ BASELI NE SURVEY 34.1 More respondents in urban than rural had paid les s than Le 50,000 for medical treatment of a household/family member in a government hospital and/or peripheral health unit (PHUs)/clinic. Table 6 highlights payment of bribes to access health services by rural/urban residence. Table 6: Payment of bribe to access health services by rural/urban residence Amount paid (SLL) Pilot district Control districts Rural (90) Urban (76) Rural (150) Urban (6) Less than Le5,000 11.1% 21.1% 6.7% 33.3% Le5,000 < Le20,000 45.6% 47.4% 50.0% 50.0% Le20,000 < Le50,000 26.7% 18.4% 33.3% 16.7% Le50,000 < Le100,000 11.1% 6.6% 6.0% 0.0% Le100,000 < Le500,000 5.6% 3.9% 3.3% 0.0% Le500,000 < Le1,000,000 0.0% 1.3% 0.0% 0.0% Above Le1,000,000 0.0% 1.3% 0.7% 0.0% Total 100.0% 100.0% 100.0% 100.0% Source: PNB Baseline, 2016 Impact Indicator 1: Water a nd Sanitation Sector 35.1 For water and sanitation, the survey focused on extra payments to water companies, government or service provider officials to obtain water. Findings indicate that 19.8% of respondents overall in pilot d istricts paid extra to get water. Additional payments for water were hardly reported in control districts because they have virtually no access to piped water. District analysis in Figure 8 indicates Kenema and Bombali districts accounting for higher perce ntages of bribe - paying respondents at 28.2% and 21.1%, respectively. Sample: Bo=100, Bombali=90, Kenema=110, West=179, Bonthe=90, Koinadugu=151 5.0% 21.1% 28.2% 8.0% 0.0% 0.7% 0.0% 5.0% 10.0% 15.0% 20.0% 25.0% 30.0% Bo Bombali Kenema Western Area Bonthe Koinadugu Pilot districts Control districts % respondents District Figure 8: Percentage of people who paid extra cost to get water to a government official, water company or service provider by district 13
19. PAY NO BRIBE/ BASELI NE SURVEY Sa mple: Bo=40, Bombali=24, Kenema=24, West=147, Bonthe=0, Koinadugu=0 42.1 When disaggregated by urban/rural area, the data indicate that slightly more respondents in urban areas (14.1%) paid extra costs for electricity than those in rural areas (11.4%). 43.1 Survey results in Table 11 reveal marked geographical differences in the payment of bribes to access electricity. A significant proportion of respondents in Kenema (42.9%) paid less than Le5 , 000 to access electricity in their homes, whereas in Bombali and Wester n Area significant proportions of respondents (66.7% and 50.0% respectively) paid between Le20 , 000 and Le50 , 000 for the same services. Table 11: Payment of bribe to access electricity from national grid by district Amount paid (SLL) Pilot districts Co ntrol districts Bo Bombali Kenema Western Area Bonthe Koinadugu Less than Le5,000 14.3% 0.0% 42.9% 0.0% - - Le5,000 < Le20,000 28.6% 33.3% 28.6% 21.4% - - Le20,000 < Le50,000 28.6% 66.7% 0.0% 50.0% - - Le50,000 < Le100,000 14.3% 0.0% 14.3% 21.4% - - Le100,000 < Le500,000 14.3% 0.0% 14.3% 0.0% - - Le500,000 < Le1,000,000 0.0% 0.0% 0.0% 7.1% - - Total 100.0 % 100.0% 100.0% 100.0% - - Source: PNB Baseline, 2016 44.1 Table 12 below indicates that rural and urban residents alike pay bribes for electricity connections, with the majority in both cases paying less than Le50 , 000 . 17.5% 12.5% 29.2% 2.9% 0.0% 0.0% 0.0% 5.0% 10.0% 15.0% 20.0% 25.0% 30.0% 35.0% Bo Bombali Kenema Western Area Bonthe Koinadugu Pilot districts Control districts % respondents Figure 9: Percentage of people who paid extra cost for (re)connection or related services to a national electricity generation/grid or electricity distribution company by district 16
27. PAY NO BRIBE/ BASELI NE SURVEY corruption and could describe one or more cases, compared to about 50.0% of those in control districts, as indicated in Table 21. Ma le respondents had more information about ACC than female respondents. Table 21: Percentage of citizens who know about ACC's work on grand corruption and can describe one or more cases by district strata and gender Pilot districts Control districts Work on grand corruption Male Female Total Male Female Total Tackle corruption 69.9% 60.9% 65.3% 52.9% 32.5% 42.7% Accept the need for transparency, accountability 16.9% 14.4% 15.7% 5.8% 5.0% 5.4% Prosecute corrupt practices 50.0% 41.6% 45.7% 34.7% 18.3% 26.6% Enhance a corrupt free society 25.8% 26.3% 26.1% 24.8% 6.7% 15.8% % citizens who know about ACC's work on grand corruption and can describe one or more cases 89.8% 77.4% 83.5% 59.5% 40.0% 49.8% Source: PNB Baseline, 2016 56.1 Data reveals more citizens in urban areas than rural areas are aware of ACC’s work on grand corruption and can describe one or more cases. As Table 22 shows, urban areas account for 91.2% of respondents in pilot districts knowing about ACC’s work on grand corruption and 60.0% in control districts. Corresponding values for rural areas are 75.8% in pilot districts and 49.4% in control areas. Somewhat unsurprisingly, most respondents in rural and urban areas were able to identify tackling corruption as one of the tasks of the ACC. Table 22: Percentage of citizens who know about ACC's work on grand corruption and can describe one or more cases by district strata and residence Pilot districts Control districts Work on grand corruption Rural Urban Total Rural Urban Total Tackle corruption 61.3% 69.5% 65.3% 42.0% 60.0% 42.7% Accept the need for transparency, accountability 13.3% 18.0% 15.7% 5.6% 0.0% 5.4% Prosecute corrupt practices 39.6% 51.9% 45.7% 26.8% 20.0% 26.6% Enhance a corrupt free society 15.8% 36.4% 26.1% 15.2% 30.0% 15.8% % citizens who know about ACC's work on grand corruption and can describe one or more cases 75.8% 91.2% 83.5% 49.4% 60.0% 49.8% Source: PNB Baseline, 2016 57.1 Output Indicator 5.3, Percentage of citizens claiming to have listened to/read information on anti - corruption in the previous 3 months: Respondents’ knowledge about anti – corruption was investigated during the baseline survey. Findings indicate some disparities between pilot and control districts, and between men and women. In pilot districts, 70.3% of male respondents and 59.3% female respondents claimed to have listened to or read information on anti - corruption in the previous 3 months, whereas in control districts the percenta ges were significantly lower. Radio was identified as the most popular source of information as Table 23 highlights. Table 23: Percentage of citizens who claim to have listened to/read information on anti - corruption in the previous 3 months by district st rata and gender 24
35. PAY NO BRIBE / BASEL INE REPORT District Estimated # households Proportion of households Estimated sample households Adjusted estimated sample households Sample EAs Pilot Districts Kenema 112,676 0.225544164 108.2611985 110 11 Bombali 92,195 0.184547234 88.58267244 90 9 Bo 105,725 0.211630309 101.5825483 100 10 Freetown 188,978 0.378278293 181.5735807 180 18 Total 499,574 1 480 480 48 Control Districts Koinadugu 73,833 0.6348987 304.7514 300 30 Bonthe 42,458 0.3651013 175.2486 180 18 Total 116,291 1 480 480 48 As a basis for comparison group design, samples for pilot and control districts were expected to be at par in order to inform comparability of data and results. However, upon the availability of resources (time and funds) to support the baseline study, the sample for the control districts were halved and proportionately allocated. Thus, the resulting sam ple for control districts were as follow: Table 2: Adjusted Sample for Control Districts Initial sample Halved sample District Estimated number of households Proportion of households Estimated sample households Adjusted estimated sample households Sample EAs Calculated Adjusted Koinadugu 73,833 0.6348987 304.7514 300 30 152.3757 150 Bonthe 42,458 0.3651013 175.2486 180 18 87.62431 90 Total 116,291 1 480 480 48 240 240 Half estimated sample 240 Recruitment and Training of Data Collectors (Enumerators & Supervisors) Twelve (12) enumerators and six (6) supervisors were recruited to collect data for the baseline survey. The data collectors were trained for three (3) days on the administration of the survey instruments/questionnaires and general survey protocols in order to equip them collect the appropriate and quality data. 32
18. PAY NO BRIBE/ BASELI NE SURVEY Bo (5) Bombali (19) Kenema (31) Western Area (40) Bonthe (0) Koinadugu (1) Less than Le5,000 100.0% 84.2% 96.8% 15.0% - 0.0% Le5,000 < Le20,000 0.0% 5.3% 0.0% 12.5% - 100.0% Le20,000 < Le50,000 0.0% 0.0% 0.0% 37.5% - 0.0% Le50,000 < Le100,000 0.0% 5.3% 0.0% 0.0% - 0.0% Le100,000 < Le500,000 0.0% 5.3% 3.2% 32.5% - 0.0% Le500,000 < Le1,000,000 0.0% 0.0% 0.0% 2.5% - 0.0% Total 100.0% 100.0% 100.0% 100.0% - 100.0% Source: PNB Baseline, 2016 39.1 Comparing payment amounts by rural and urban areas, Table 10 below, results indicate that more than 80% of respondents in rural areas paid bribes of less than Le 5,000 to access water whilst in urban areas a greater proportion (43.9%) of respondents paid b etween Le20,000 and Le500,000, with a similar proportion (45.6%) paying below Le5,000. Table 10: Payment of bribe to access water by rural/urban residence Amount paid (SLL) Pilot districts Control districts Rural Urban Total Rural Urban Total Less than Le5,000 81.6% 45.6% 60.0% 0.0% 0.0% 0.0% Le5,000 - Le20,000 2.6% 8.8% 6.3% 100.0% 0.0% 100.0% Le20,000 - Le50,000 2.6% 24.6% 15.8% 0.0% 0.0% 0.0% Le50,000 - Le100,000 2.6% 0.0% 1.1% 0.0% 0.0% 0.0% Le100,000 - Le500,000 10.5% 19.3% 15.8% 0.0% 0.0% 0.0% Le500,000 - Le1,000,000 0.0% 1.8% 1.1% 0.0% 0.0% 0.0% Total 100.0% 100.0% 100.0% 100.0% 0.0% 0.0% Source: PNB Baseline, 2016 Impact Indicator 1: Energy Sector (Electricity) 40.1 For electricity, respondents were asked to indicate to whether they had paid additional costs for (re)connection or related services to a national electricity generation/grid or electricity distribution company. It should be noted that national electricity generation is available only in regional headquarter towns (cities) of of Bo, Kenema, Makeni and Freetown and adjacent rural areas in the pilot districts; no electricity is available in the two control districts (Bonthe and Koinadugu). 41.1 Overall, 13.2% of respondents in pilot districts (combined) confirmed that they had paid additional costs. At 29.25%, Kenema district accounted for highest proportion of those paying extra according to Figure 9, while Western Area recorded the lowest occurrence (2.9%). 15
20. PAY NO BRIBE/ BASELI NE SURVEY Table 12: Payment of bribe to access electricity from national grid by rural/urban residence Amount paid (SLL) Pilot district Control districts Rural Urban Total Rural Urban Total Less than Le5,000 22.2% 9.1% 12.9% - - - Le5,000 < Le20,000 22.2% 27.3% 25.8% - - - Le20,000 < Le50,000 33.3% 36.4% 35.5% - - - Le50,000 < Le100,000 11.1% 18.2% 16.1% - - - Le100,000 < Le500,000 11.1% 4.5% 6.5% - - - Le500,000 < Le1,000,000 0.0% 4.5% 3.2% - - - Total 100.0% 100.0% 100.0% - - - Source: PNB Baseline, 2016 Impact Indicator 1: Police 45.1 Payments to police officers for assistance and/or services or avoidance of a problem 7 were investigated during the survey. Slightly over one - quarter of respondents (26.1%) in pilot districts (combined) mentioned having paid a police officer for assistance etc. but more than twice this proportion of respondents (57.7%) reported having paid a bribe in control districts. Koinadugu district recorded the highest incidence at 64.2% as shown in Figure 10. Sample: Bo=100, Bombali=90, Kenema=110, West=179, Bonthe=90, Koinadugu=151 46.1 Analysing payment amounts by urban/rural residence revealed 30.5 % of respondents in urban areas and 21.7% of those in rural areas had paid police in pilot districts. 8 Results in Table 13 indicate that most respondents in both rural and urban areas had paid a bribe of between Le 5,000 and Le 20,000. 7 For example, passing a checkpoint or avoiding a fine or arrest 8 Lack of urban data in control districts is being investigated 15.0% 33.3% 36.4% 16.0% 46.7% 64.2% 0.0% 10.0% 20.0% 30.0% 40.0% 50.0% 60.0% 70.0% Bo Bombali Kenema Western Area Bonthe Koinadugu Pilot districts Control districts % respondents District Figure 10: Percentage of people who paid paying a police officer for assistance/services or avoiding a problem by district 17
22. PAY NO BRIBE/ BASELI NE SURVEY Table 15: Involvement of police in corruption Level of trust Pilot districts Control districts Kenema (125) Bombali (96) Bo (110) Western Area (238) Bonthe (31) Koinadugu (56) None 0.0% 6.3% 7.3% 3.4% 6.5% 0.0% Some of them 22.4% 43.8% 27.3% 27.7% 22.6% 32.1% Most of them 30.4% 31.3% 26.4% 30.7% 41.9% 53.6% All of them 20.0% 15.6% 38.2% 36.1% 29.0% 14.3% Don't know/Haven't heard enough 27.2% 3.1% 0.9% 2.1% 0.0% 0.0% Total 100.0% 100.0% 100.0% 100.0% 100.0% 100.0% Source: Afro Barometer Round 6, 2015 49.1 In terms of amounts paid to the police as bribes, findings indicate that more than 60% of respondents in Bo, Kenema, Bonthe and Koinadugu districts paid Le20,000 or less to the police, whereas in Western Area bribes paid were higher: 60% of respondents paid above Le 50,000 as shown in Table 16 below. Table 16: Payment of bribe to police for assistance/services by district Amount paid (SLL) Pilot districts Control districts Bo Bombali Kenema Western Area Bonthe Koinadugu Less than Le5,000 13.3% 40.0% 30.0% 2.5% 31.0% 11.3% Le5,000 - Le20,000 46.7% 36.7% 40.0% 12.5% 45.2% 62.9% Le20,000 - Le50,000 0.0% 16.7% 15.0% 25.0% 21.4% 22.7% Le50,000 - Le100,000 6.7% 3.3% 10.0% 42.5% 0.0% 3.1% Le100,000 - Le500,000 26.7% 3.3% 5.0% 10.0% 2.4% 0.0% Le500,000 - Le1,000,000 6.7% 0.0% 0.0% 5.0% 0.0% 0.0% Above Le1,000,000 0.0% 0.0% 0.0% 2.5% 0.0% 0.0% Total 100.0% 100.0% 100.0% 100.0% 100.0% 100.0% 19
23. PAY NO BRIBE/ BASELI NE SURVEY 6 Detailed Baseline Findings by Logframe Indicator: Outcome Level 50.1 Outcome Indicator 3a: Percentage of people who believe that ordinary people can make a difference in fighting corruption; and Outcome Indicator 3b: percentage of people thinking that the news media are effective in reveal ing government mistakes and corruption: 3a and 3b were determined using Afrobarometer Round 6 data, in Table 17 below. Results vary by district: only 18.4% of respondents in Kenema either agreed or strongly agreed that ordinary people can make a difference , whereas 60.8% of respondents in Koinadugu agreed or strongly agreed. Respondents in Bo (61.0%) and Bonthe (54.8%) disagreed or strongly disagreed with the statement. Around of 50% of respondents in all districts except Kenema felt that the media are effe ctive at revealing government mistakes and corruption (Table 18). In Kenema, more people claimed that they didn’t know. Table 17: People can fight corruption Source: Afro Barometer Round 6, 2015 Table 18: Effectiveness of the news media to reveal government mistakes and corruption Effectiveness Pilot districts Control districts Kenema (125) Bombali (96) Bo (110) Western Area (238) Bonthe (31) Koinadugu (56) Not at all effective 2.4% 6.3% 10.0% 16.0% 0.0% 5.4% Not very effective 9.6% 12.5% 23.6% 31.1% 22.6% 7.1% Somewhat effective 12.8% 19.8% 44.5% 16.4% 25.8% 3.6% Very effective 12.0% 34.4% 13.6% 31.9% 29.0% 48.2% Don't know 63.2% 27.1% 8.2% 4.6% 22.6% 35.7% Strength Pilot districts Control districts Kenema Bombali Bo Western Area Bonth e Koinadugu Missing 0.0% 0.0% 0.9% 0.0% 0.0% 0.0% Strongly Disagree 22.4% 28.1% 45.5% 31.1% 41.9% 25.0% Disagree 9.6% 11.5% 15.5% 10.1% 12.9% 7.1% Neither Agree nor Disagree 13.6% 3.1% 13.6% 8.8% 6.5% 1.8% Agree 14.4% 21.9% 4.5% 18.1% 25.8% 42.9% Strongly Agree 4.0% 19.8% 14.5% 29.8% 6.5% 17.9% Don’t Know 36.0% 15.6% 5.5% 2.1% 6.5% 5.4% Total 100.0% 100.0% 100.0% 100.0% 100.0% 100.0% 20
15. PAY NO BRIBE/ BASELI NE SURVEY 32.1 Of those paying, Table 5 6 below indicates that more than 90% of people in Bo, Bombali and Koinadugu districts paid less than Le 50,000 to a health worker in a government hospital and/or PHU or clinic for consultation or medication for a member of household/family. In Kenema, Bonthe and Western Area, 75 - 89% of respondents paid less than Le 50,000. Table 5: Payment of bribery to access health services by district Source: PNB Baseline, 2016 33.1 Put another way, most people who paid bribes in both pilot and control districts paid Le 50,000 or less for medical treatment as Figure 7 shows. Sample: Pilot districts = 166; control districts =156 6 The apparent duplication between Kenema and Bonthe, and Western Area and Koinadugu is probably an error. We are investigating 15.7 46.4 22.9 9.0 4.8 0.6 0.6 7.7 50.0 32.7 5.8 3.2 0.0 0.6 0.0 10.0 20.0 30.0 40.0 50.0 60.0 < Le5,000 Le5,000 < Le20,000 Le20,000 < Le50,000 Le50,000 < Le100,000 Le100,000-Le500,000 Le500,000 < Le1,000,000 > Le1,000,000 Percent (%) Amount paid (SLL) Figure 7: Payment of bribe to access health services by district Control district Pilot district Amount paid (SLL) Pilot districts Control districts Bo (42) Bombali (45) Kenema (53) Western Area (26) Bonthe (58) Koinadugu (98) Less than Le5,000 14.3% 24.4% 6.9% 17.0% 6.9% 17.0% Le5,000 < Le20,000 57.1% 51.1% 43.1% 28.3% 43.1% 28.3% Le20,000 < Le50,000 21.4% 20.0% 25.9% 22.6% 25.9% 22.6% Le50,000 < Le100,000 4.8% 4.4% 13.8% 18.9% 13.8% 18.9% Le100,000 < Le500,000 2.4% 0.0% 8.6% 13.2% 8.6% 13.2% Le500,000 < Le1,000,000 0.0% 0.0% 0.0% 0.0% 0.0% 0.0% Above Le1,000,000 0.0% 0.0% 1.7% 0.0% 1.7% 0.0% Total 100.0% 100.0% 100.0% 100.0% 100.0% 100.0% 12
21. PAY NO BRIBE/ BASELI NE SURVEY Table 13: Payment o f bribe to police by rural/urban residence Amount paid (SLL) Pilot districts Control districts Rural Urban Total Rural Urban Total Less than Le5,000 25.0% 19.2% 21.6% 17.3% 0.0% 17.3% Le5,000 - Le20,000 34.6% 28.8% 31.2% 57.6% 0.0% 57.6% Le20,000 - Le50,000 11.5% 20.5% 16.8% 22.3% 0.0% 22.3% Le50,000 - Le100,000 17.3% 19.2% 18.4% 2.2% 0.0% 2.2% Le100,000 - Le500,000 9.6% 8.2% 8.8% 0.7% 0.0% 0.7% Le500,000 - Le1,000,000 1.9% 2.7% 2.4% 0.0% 0.0% 0.0% Above Le1,000,000 0.0% 1.4% 0.8% 0.0% 0.0% 0.0% Total 100.0% 100.0% 100.0% 100.0% 0.0% 100.0% Source: PNB 2016 47.1 Higher levels of mistrust in the police were manifested in two districts, Western Area and Koinadugu, where more than 50% of respondents stated that they had no trust at all in the police (see Table 14 below). Across all districts except Kenema, more than 50% of respondents claimed to have no trust or just a little trust. In Kenema more than 20% of people claimed to have a lot of trust in the police. Table 14: Extent of trust in the police Source: Afro Barometer Round 6, 2015 48.1 Perceptions of police involvement in corruption were investigated in the Afrobarometer Round 6 survey (Table 15, below). Over 46% of people in all districts thought that ‘most’ or ‘all’ of the police were involved in corruption, but in Kenema more people (27.2%) also claimed that they didn’t know or hadn’t heard enough. Level of trust Pilot districts Control districts Kenema (125) Bombali (96) Bo (110) Western Area (238) Bonthe (31) Koinadugu (56) Not at all 18.4% 44.8% 36.4% 54.2% 29.0% 60.7% Just a little 24.0% 26.0% 27.3% 18.9% 54.8% 19.6% Somewhat 21.6% 20.8% 20.0% 10.9% 9.7% 12.5% A lot 22.4% 7.3% 15.5% 15.5% 6.5% 7.1% Don't know/Haven't heard enough 13.6% 1.0% 0.9% 0.4% 0.0% 0.0% Total 100.0% 100.0% 100.0% 100.0% 100.0% 100.0% 18
38. PAY NO BRIBE / BASEL INE SURVEY Annex Two : Survey Respondents Background Respondents’ Demographic and Socio - Economic Information In total, there were 720 respondents to the household survey during the baseline survey; which included 479 in pilot districts and 241 in control districts. Figure 1 shows gender of respondents. In both strata, almost equal proportions of male and female w ere interviewed during the survey. Sample: pilot districts 479; control districts 241 The highest level of education attainment is given in Table 1. In all districts, except Western Area and Koinadugu, significantly high proportions of respondents had never attended school. Only in Western Area and Koinadugu were there over two - thirds of respondents had attained primary, junior, senior or post - secondary/higher education. Table 1: Highest level of education of respondents b y district Highest level Pilot districts Control districts Bo (51) Bombali (44) Kenema (54) Western Area (87) Bonthe (46) Koinadugu (75) None 45.0% 44.4% 50.9% 27.9% 45.6% 20.5% Primary 18.0% 16.7% 15.5% 6.1% 13.3% 25.8% Junior Sec. School 14.0% 14.4% 13.6% 15.1% 11.1% 25.8% Senior Sec. School 8.0% 18.9% 9.1% 33.5% 13.3% 11.9% Post - Secondary/Higher 10.0% 5.6% 7.3% 16.2% 6.7% 4.6% Others (Quranic educ.) 5.0% 0.0% 3.6% 1.1% 10.0% 11.3% Total 100.0% 100.0% 100.0% 100.0% 100.0% 100.0% Surprisingly, more respondents in pilot districts than in control districts (combined) had no education at all (39.9% compared to 29.9%). Higher percentage of respondents in control districts have had primary and junior secondary education whilst the trend reverses for respondents with senior secondary and post - secondary education. Figure 2 presents highest level of education of respondents. 35
12. PAY NO BRIBE/ BASELI NE SURVEY Source: Afro Barometer, Round 6 2015 25.1 For education, the majority of respondents in all districts who paid a bribe, claimed to have given Le 20,000 or less to teachers or school authorities for placement of children in school as shown in Table 2 below. Table 2: Payment of bribery to access s ervices in Education by district Amount paid (SLL) Pilot districts Control districts Bo (48) Bombali (56) Kenema (52) Western Area (69) Bonthe (55) Koinadugu (90) Less than Le5,000 54.2% 42.9% 25.5% 48.1% 25.5% 48.1% Le5,000 < Le20,000 35.4% 39.3% 43.6% 36.5% 43.6% 36.5% Le20,000 < Le50,000 8.3% 8.9% 20.0% 7.7% 20.0% 7.7% Le50,000 < Le100,000 0.0% 7.1% 9.1% 3.8% 9.1% 3.8% Le100,000 < Le500,000 2.1% 1.8% 1.8% 3.8% 1.8% 3.8% Total 100.0% 100.0% 100.0% 100.0% 100.0% 100.0% Source: PNB Baseline, 2016 26.1 Figure 5 presents payment of bribes more clearly by pilot and control districts. Kenema (125) Bombali (96) Bo (110) Western Area (238) Bonthe (31) Koinadugu (56) Missing 4.8% 5.2% 3.6% 5.9% 0.0% 3.6% Never 25.6% 26.0% 62.7% 53.4% 67.7% 33.9% Once or Twice 0.0% 8.3% 2.7% 5.0% 6.5% 3.6% A Few times 0.0% 1.0% 5.5% 3.8% 6.5% 0.0% Often 0.0% 2.1% 5.5% 6.3% 0.0% 0.0% No contact 68.8% 55.2% 20.0% 25.2% 19.4% 58.9% Don’t know 0.8% 2.1% 0.0% 0.4% 0.0% 0.0% Total 100.0% 100.0% 100.0% 100.0% 100.0% 100.0% 9
33. PAY NO BRIBE / BASEL INE REPORT Annex One: Survey Approaches a nd Methodologies Baseline Methodology Survey Scope and Approach The baseline survey was conducted in the four (4) pilot PNB project districts (Bo, Kenema, Bombali and Western Area Rural Urban ) and additional two (2) districts that provided a suitable control group as required for the survey ToR. Bonthe and Koinadugu di stricts were proposed because of their relatively remote geographical locations and presumed cultural differences. Quantitative and qualitative methods were employed to collect data for the baseline survey. The approach relied on five (5) key components, n amely: 1. Desk review; 2. Household Survey; 3. Key Informant Interviews; 4. Focus group discussion; and 5. Analysis of related questions in the Afrobarometer round 6 dataset. The desk review formed the start point of the baseline study and provided an opportunity for the consultants to understand the context relating to the study as well as the framework for designing the survey, examine and underscore issues relating to corruption in Sierra Leone. The review involved consulting project documents, national policies to wards tackling corruption and previous studies relating to corruption including Anti - Corruption Commission’s Perception Surveys on Corruption, Transparency International Reports, Afro b arometer Reports, etc. The desk reviews provided secondary data for the baseline. The household survey targeted the households to provide information on issues relating to corruption and perception on corruption in their localities. The key informant interviews targeted community authorities/heads of public institutions and other related stakeholders. The focus group discussion s involved discussions on concepts of corruption with community groups of individuals including youths and adults. The analysis of data on related questions in the Afrobarometer round 6 dataset involve d the analysis and presentation of data on additional questions to the baseline study. The additional questions (developed in consultation with the Coffey technical assistant) were intended to fill gaps left by existing material, and provide information ar ound relevant PNB questions; as per objective ‘i’ of the ToR. Survey Tools Separate structured and semi - structure questionnaires were designed and used as baseline survey instruments in collecting data from the respective target audience. These included: • Household Questionnaire; • Key Informant Interview Questionnaire; • Focus Group Discussion Guide; and (for analyses of additional PNB questions) • Afrobarometer round 6 Survey The household questionnaires formed the tool for household survey; administered to in dividuals (preferably adults) aged 18 years or above. The key informant interview guide was used to carry out in - depth interviews with selected community authorities and stakeholders (opinion leaders). 30
17. PAY NO BRIBE/ BASELI NE SURVEY 36.1 Overall, 23.8% of urban respondents and 15.8% of rural respondents paid extra costs for water in pilot distr icts. Analysis of data indicates that most respondents paid extra costs for water from tap/piped sources in urban pilot areas. Unsurprisingly, wells with hand pumps accounted for highest extra costs in rural pilot areas. The relatively high numbers in urb an pilot areas could be as a result of the high demands of growing urban populations. Table 7: Percentage of people who had paid extra cost for water by rural/urban residence Main source Pilot districts Control districts Rural (38) Urban (57) Total (95) Rural (0) Urban (1) Total (1) Tap/pipe borne 23.7% 52.6% 41.1% - 100.0% 100.0% Hand pump well 57.9% 31.6% 42.1% - 0.0% 0.0% Ordinary well 13.1% 15.8% 14.7% - 0.0% 0.0% River/Stream 5.3% 0.0% 2.1% - 0.0% 0.0% Total 100.0% 100.0% 100.0% - 100.0% 100.0% Source: PNB Baseline, 2016 37.1 Further analysis of water sources by district (Table 8 below) highlight that respondents largely paid additional costs for water from wells with hand pumps in three districts (Bo 80.0%, Bombali 68.4%, Kenema 51.6%) and fo r tap/piped water in Western Area (67.5%). Table 8: Main water source for which people had paid extra cost for water by district Main source Pilot districts Control districts Bo (5) Bombali (19) Kenema (31) Western Area (40) Bonthe (0) Koinadugu (1) Tap/pipe borne 20.0% 0.0% 35.5% 67.5% - 100.0% Hand pump well 80.0% 68.4% 51.6% 17.5% - 0.0% Ordinary well 0.0% 21.1% 12.9% 15.0% - 0.0% River/Stream 0.0% 10.5% 0.0% 0.0% - 0.0% % people paying bribe to access water 100.0% 100.0% 100.0% 100.0% - 100.0% Source: PNB Baseline, 2016 38.1 Of respondents who paid additional costs, Table 9 shows that those in Bo district and more than 80% of those in Bombali and Kenema districts paid less than Le 5,000 to access water in their communities. Highest payments w ere recorded in Western Area, where 70.0% of respondents paid between Le 20,000 and Le50 , 000 or between Le 100,000 and Le 500,000. Table 9: Payment of bribe to access water by district Amount paid (SLL) Pilot districts Control districts 14
14. PAY NO BRIBE/ BASELI NE SURVEY extra cost for health services than those in urban areas (33.8%: 76/225). In the control districts, 67.6% of respondents in rural areas and 60.0% in urban areas had paid extra costs. 30.1 Among people who paid for at least one health service, Table 3 below identifies the ser vices for which they paid, by district. Findings reveal more respondents paid for under five child health care than any of the other health services in all districts; with Bombali (38.0%) being the highest in the pilot districts and Bonthe (32.2%) being th e higher of the two control districts. Table 3: Percentage of people who paid extra cost for health services by district Health services Pilot districts Control districts Bo (91) Bombali (79) Kenema (110) Western Area (173) Bonthe (87) Koinadugu (145) Under five child health care 27.5% 38.0% 31.8% 7.5% 32.2% 21.4% Antenatal care (for pregnant women) 7.7% 17.7% 20.0% 4.6% 19.5% 21.4% Postnatal care (for lactating mothers) 3.3% 26.6% 3.6% 0.6% 31.0% 14.5% Others 9.9% 6.3% 6.4% 2.9% 19.5% 15.9% % people paying bribe at public clinic/hospital 46.2% 57.0% 48.2% 15.0% 66.7% 67.6% Source: PNB Baseline, 2016 31.1 Analysing the data by rural and urban status, Table 4, below shows that greater proportions of respondents in rural areas had paid for two health services (under five child health care 24.9% and antenatal services for pregnant women 15.3%) across pilot dis tricts. In control districts, extra payments for under five child health care were higher in urban areas (40.0%) whilst those for antenatal services were higher in rural areas (27.4%). Table 4: Percentage of people who paid extra cost for health services by rural/urban residence Health services Pilot districts Control districts Rural ( 229) Urban ( 234) Total (463) Rural ( 215) Urban ( 10) Total ( 225) Under five child health care 24.9% 19.7% 22.2% 25.6% 40.0% 26.2% Antenatal services (for pregnant women) 15.3% 12.0% 13.6% 27.4% 10.0% 26.7% Postnatal services (for lactating mothers) 5.2% 7.3% 6.3% 22.3% 0.0% 21.3% Others 5.7% 5.6% 5.6% 17.2% 30.0% 17.8% % people paying bribe at public clinic/hospital 39.5% 33.8% 36.6% 67.6% 60.0% 67.2% Source: PNB Baseline, 2016 11
34. PAY NO BRIBE / BASEL INE REPORT The focus group discussion guide was used to conduct the focus group discussions The Afrobarometer round 6 Survey was used to carry out analyses of additional PNB questions Sample design The sample design employed a probability sampling techniques (cluster, stratified and systematic) to select the appropri ate sample for the survey. This ensured that the sample is representative and survey results provided an unbiased estimate of the views of the population. A random selection at every stage of sampling and probability proportionate to population size (PPPS) was applied for the sampling. Essentially, the PPPS provided self - weighting to the sample. Sampling was done separately for pilot and control districts. The sample was selected at two stages. At the first stage, sample of enumeration areas (EAs) were sel ected. The EAs constituted the primary sampling unit. The list of all enumeration areas, as determined by Statistics Sierra Leone, in all the six (6) survey districts formed the sampling frame. At the second stage, ten (10) households per sample EA for int erview. Households were selected using the “random walk” in the absence household listing for pre - selection of households (the preferred method). For the key informant interviews, at least three (3) community public institutions were targeted at random. Tw o survey (2) EAs were randomly selected per district for the focus group discussions (FGDs). Each FGD consisted of 7 - 12 persons from the communities at large. However, the study revealed that not all survey communities hosted the public institutions / faci lities under review (health, WATSAN, education, electricity and police) and therefore could not achieve the target number (216) of KIIs. Also, non - responses in certain survey communities contributed to the study not achieving the target number of KIIs. Sam ple Calculation The sample size of the primary sampling unit (PSU) was determined by the number of households to be surveyed in six (6) districts. Hence, the sample size of households was calculated by the formula given below: ____________________________ _____________________________________________ n = N Z 2 ∗ 0 . 25 [ d 2 ∗ N − 1 ] + [ Z 2 ∗ 0 . 25 ] where; • n is sample size required • N is total (estimated) households in the domain • Z is number of standard deviation units of the sampling distribution corresponding to the 95% confidence level. • d is 5% precision level or margin of error. _________________________________________________________________________ Anticipating 80% response rate for the survey, the sample was inflated by the response rate in order to pay - off for the possibly 20% non - response. The sample was allocated across the six (6) districts using probability proportionate to population size (PP P S) approach. Applying the formula, sample sizes are 480 households, each, in pilot districts and control districts. Allocation of the sample sizes was based on household proportion for the districts computed from household numbers in the 20 15 Housing and Population Cen sus . Thus the allocation of sample s is given below: Table 1: Allocation of sample households and EAs 31
40. PAY NO BRIBE / BASEL INE SURVEY Table 4: Employment status of respond ents by district Employment status Pilot district ( N=479 ) Control district ( N=241 ) Bo (51) Bombali (44) Kenem a (54) Wester n Area (87) Bonthe (46) Koinadug u (75) Formal (receiving salary/wage worker) 12.0% 7.8% 6.4% 20.1% 12.2% 15.2% Informal (engaged in petty trading, farming, gardening, animal rearing, poultry, etc.) 51.0% 55.6% 73.6% 38.5% 61.1% 54.3% Semi - Formal (engaged in skilled work e.g. Mason, Carpentry, Mechanic, driver, etc.) 9.0% 8.9% 4.5% 16.8% 3.3% 15.9% % of respondents engaged in econ omic activity 72.0% 72.2% 84.5% 75.4% 76.7% 85.4% Data disaggregated by gender indicates that women are mostly engaged in informal activities than men. But they (women) are scarcely gainfully employed or engaged in semi - formal activities which were accounted higher for men as Table 5 shows. Table 5: Empl oyment status of respondents by district strata and gender Employment status Pilot district ( N=479 ) Control district ( N=241 ) Male Female Total Male Female Total Formal (Salary/wage worker) 15.3% 10.7% 12.9% 19.0% 7.9% 13.0% Informal (Petty trading, farming, gardening, animal rearing, poultry, etc.) 44.1% 60.5% 52.4% 48.8% 55.7% 52.5% Semi - Formal (Skilled worker e.g. Mason, Carpentry, Mechanic, driver, etc.) 19.5% 2.5% 10.9% 20.7% 1.4% 10.3% % of respondents engaged in economic activity 78.8% 73.7% 76.2% 88.4% 65.0% 75.9% Data evidence respondents’ engagement in economic activities is somewhat associated with residence status in terms of rural/urban especially for pilot districts. More rural respondents were found to be engaged in informal activiti es whereas respondents in urban areas are gainfully employed or semi - formal activities. Table 6 shows employment status of respondents by district strata and residence (rural/urban). Table 6: Employment status of respondents by district strata and residenc e (rural/urban) Employment status Pilot district ( N=479 ) Control district ( N=241 ) Rural Urban Total Rural Urban Total Formal (Salary/wage worker) 10.4% 15.5% 12.9% 14.7% 0.0% 14.1% Informal (Petty trading, farming, gardening, animal rearing, poultry, etc.) 62.9% 41.8% 52.4% 55.4% 90.0% 56.8% Semi - Formal (Skilled worker e.g. Mason, Carpentry, Mechanic, driver, etc.) 7.1% 14.6% 10.9% 11.7% 0.0% 11.2% % of respondents engaged in economic activity 80.4% 72.0% 76.2% 81.8% 90.0% 82.2% Respondents were asked to state income earned monthly from the main economic activities they were engaged in at the time of the baseline survey. Figure 3 presents average monthly income of respondents by district strata and residence. The average monthly i ncome was estimated as the total income of all respondents in the previous month before the survey divided by the number of respondents that responded. Reader should note that not all sample respondents could state their income. Survey results revealed tha t average monthly income is higher in control districts (SLL 435,095.54) than pilot districts (SLL 290,884.35). Also respondents in rural areas accounted for slightly higher average income (SLL 344,847.40) than those in the urban areas (SLL 332,986.01). 37
39. PAY NO BRIBE / BASEL INE SURVEY Sample: pilot districts = 479; control districts = 241 Table 2 shows highest level of education of respondents by district strata. Survey results indicate that more female respondents than their male counterpart generally have had no education in both pilot and control districts. Table 2: Highest level of e ducation of respondents by district strata Highest level Pilot districts ( N=479 ) Control districts ( N=241 ) Male Female Total Male Female Total None 15.4% 24.4% 39.9% 11.2% 18.7% 29.9% Primary 6.1% 6.7% 12.7% 8.7% 12.4% 21.2% Junior Sec. School 6.7% 7.7% 14.4% 9.5% 10.8% 20.3% Senior Sec. School 11.7% 8.1% 19.8% 7.9% 4.6% 12.4% Post - Secondary/Higher 7.3% 3.5% 10.9% 4.6% 0.8% 5.4% Others 2.1% 0.2% 2.3% 8.3% 2.5% 10.8% Total 49.3% 50.7% 100.0% 50.2% 49.8% 100.0% The age distribution of respondents in Table 3 ranks respondents aged (18 - 35) years higher for both district strata; indicating many respondents were youths in Sierra Leone context. There are more female youth respondents than male youths. However, more ma les were interviewed than females in the older ages. Table 3: Age distribution of respondents by district strata and gender Age group (years) Pilot district (N=479) Control district (N=241) Male Female Total Male Female Total 18 - 35 19.0% 26.9% 45.9% 16.6% 29.9% 46.5% 36 - 49 16.9% 15.0% 31.9% 20.7% 17.4% 38.2% 50+ 13.4% 8.8% 22.1% 12.9% 2.5% 15.4% All Ages 49.3% 50.7% 100.0% 50.2% 49.8% 100.0% Respondents were asked about their main economic activity; that is, activity that gives them the most income. For the purpose of the survey, economic activity was categorized into formal (gainfully employed and receiving regular salary/wage), informal (engaged in petty trading, farming, gardening, animal rearing, poultry, etc. that earn income) and se mi - formal (engaged in skilled works e.g. Mason, Carpentry, Mechanic, driver, etc.). Data suggests that 72 - 85% of respondents reported being engaged in an economic activity. Respondents’ engagement in economic activity is reported less in pilot districts co mpared to control districts. Across all districts, majority of respondents are engaged in informal activities according to Table 4. Fewer respondents are either gainfully employed or engaged in semi - formal activities . 36
Views
- 13604 Total Views
- 11411 Website Views
- 2193 Embeded Views
Actions
- 0 Social Shares
- 0 Likes
- 0 Dislikes
- 0 Comments
Share count
- 0 Facebook
- 0 Twitter
- 0 LinkedIn
- 0 Google+
Embeds 12
- 397 www.anticorruption.gov.sl
- 4 www.pnb.gov.sl
- 44 35.176.107.124
- 53 anticorruption.gov.sl:8069
- 19 www.anticorruption.gov.sl:8069
- 18 35.176.107.124:8069
- 62 anticorruption.gov.sl
- 23 webdisk.anticorruption.gov.sl
- 4 google.com'
- 36 35.176.107.124:8072
- 2 www.google.com
- 2 m.baidu.com
-
Behavioural analysis of Bribery in Sierra Leone
14749 Views . -
Executive Summary – Baseline Survey
13009 Views .
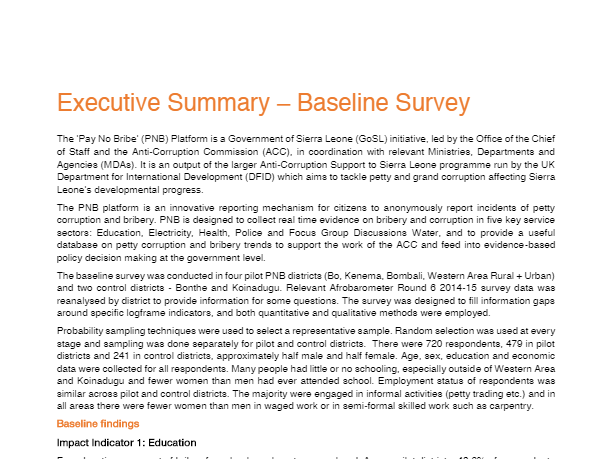
-
-
IACAlumnus_Jul_2018_online
32833 Views . -
Commissioner's Profile
26378 Views . -
NACS ACTION PLAN
22966 Views . -
-
National Anti-Corruption Strategy 2019-2023
21868 Views . -
ANNUAL REPORT FOR 2016 (2017) FINAL
20398 Views . -
ELECTRICITY service_delivery_charter_EDSA
20208 Views . -
CURRENT ACC CONVICTIONS FROM 2000 TO 2018
19463 Views . -
ACC ANNUAL REPORT FOR 2017
19120 Views . -
ACC Act 2008
18901 Views . -
ANNUAL REPORT FOR 2014
18860 Views . -
NACS NATIONAL ANTI-CORRUPTION STRATEGY 2018-2020
18444 Views . -
-Draft-SALWACO-SERVICE-CHARTER
18065 Views . -
Reports Curbing Salary Double Dipping in MDAs
17937 Views . -
Police Service-Delivery-Charter-2015-final-2
17266 Views . -
Press Release - ACC Head Office
15727 Views . -
ACC 2020 REPORT 1
15246 Views . -
APPEAL CASES
14849 Views . -
Behavioural analysis of Bribery in Sierra Leone
14749 Views .